Descriptive analysis shows that the “Vučić/Stability” frame had higher overall volume, while the “Blockaders/Chaos” frame was more explosive and strongly concentrated around election day.
1. From introduction to results: what descriptive statistics tell us first
In the first part of the series, we explained why it is useful to treat politically meaningful words as data. Words in an election campaign are not merely isolated expressions or random quotations. When they are repeated day after day, when they intensify around key election dates, and when they build recognisable images of political reality, they become traces of public political framing.
In this second part, we move from the question “what are we measuring and why?” to the question “what do the data show?” The focus is on descriptive results. This means that we are not yet going deeply into formal statistical models. Instead, we examine the basic indicators: total number of mentions, average daily count, number of articles, saturation, changes across subperiods, and the highest-count days.
Descriptive statistics matter because they provide the first and most understandable layer of evidence. They answer the questions that readers naturally ask before modelling begins: which frame appeared more often, in how many articles, did intensity change after the election announcement, was election day special, and was one frame more widespread while the other was more concentrated?
This analysis follows two groups of terms. The first is “Blockaders AND Chaos”, a negative or delegitimising frame that can associate opposition or protest actors with blockade, disorder, and chaos. The second is “Vučić AND Stability”, a positive or legitimising frame that can associate the president, the government, or the ruling political side with stability, order, and continuity.
The most important introductory finding of this part is that the two frames do not behave in the same way. “Vučić AND Stability” has a higher total number of mentions and appears in more articles. However, “Blockaders AND Chaos” is more explosive, especially on election day. In other words, one frame is more frequent and more stable over the period, while the other is more volatile and more sharply concentrated at a politically sensitive moment.
This initial result should be read as a basic map. It does not yet tell us what is statistically significant once we account for weekdays, excess variability, or the structure of count data. That will be the subject of the third part. But even now, we can see that total volume, article presence, and election-day spikes do not tell exactly the same story.
2. Total volume: which frame appeared more often
The first and simplest indicator is the total number of term mentions during the observed period. In the Politics section of Kurir.rs, from 1 January to 24 May 2026, the “Blockaders AND Chaos” group was recorded 5,098 times. The “Vučić AND Stability” group was recorded 6,034 times.
This means that, in overall volume, the “Vučić AND Stability” frame was more frequent. Its average daily count was 41.90, compared with 35.40 for “Blockaders AND Chaos”. The difference is not trivial: the stability frame had roughly 18% more total mentions over the observed period.
This result is important because it corrects a possible first impression. Because “Blockaders AND Chaos” has an enormous spike on election day, one might easily assume that it was the dominant frame across the whole period. But when all days are added together, “Vučić AND Stability” has the higher total volume. It appears to function as a broader and more persistent frame across the observed period.
Table 1. Descriptive statistics: total mentions, total articles, mean mentions/day, mean saturation, pre-announcement mean, announcement-election mean, post-election mean
| Term group | Blokader | Vučić |
|---|---|---|
| Selected words | Blokaderi AND Haos, including word variations such as blokada, blokader*, haotič* | Vučić AND Stabilnost, including word variations such as stabiln* |
| Days | 144 | 144 |
| Total mentions | 5098 | 6034 |
| Total articles | 519 | 617 |
| Mean mentions/day | 35.4 | 41.9 |
| Median mentions/day | 21.5 | 30 |
| Mean articles/day | 3.6 | 4.28 |
| Mean saturation (mentions/article) | 9.97 | 9.41 |
| Pre-announcement mean mentions/day | 22.81 | 26.17 |
| Announcement-election mean mentions/day | 52.34 | 64.66 |
| Post-election mean mentions/day | 36.73 | 42.57 |
| Change: announcement-election vs pre (%) | 129.5 | 147.1 |
| Change: post-election vs pre (%) | 61 | 62.7 |
| Pre-announcement mean articles/day | 2.25 | 2.64 |
| Announcement-election mean articles/day | 5.57 | 6.06 |
| Post-election mean articles/day | 3.66 | 4.73 |
| Pre-announcement saturation | 9.63 | 9.29 |
| Announcement-election saturation | 9.93 | 10.61 |
| Post-election saturation | 10.27 | 8.8 |
Intuitively, total mentions measure the overall strength of a frame’s presence in the text. If a frame appears more than 6,000 times in less than five months, it is not a marginal expression. It is part of the repeated language of the section. But total volume does not tell the whole story. It does not show whether the frame was evenly distributed, whether it was tied to particular dates, or whether it appeared in many articles or was repeated intensively in fewer texts. That is why the next step is to examine article counts.
3. Article counts: broad presence or concentrated repetition
The second indicator is the number of articles in which the observed terms appeared. This measure is important because it distinguishes breadth of presence from mere repetition. If a term appears in many articles, the frame is widely distributed across the daily political content. If it appears many times in a small number of articles, we are seeing concentrated repetition within a limited number of texts.
Over the observed period, terms from the “Blockaders AND Chaos” group appeared in 519 articles. Terms from the “Vučić AND Stability” group appeared in 617 articles. Therefore, “Vučić AND Stability” did not only have a higher total number of mentions; it was also present in more articles.
This is an important finding. It suggests that the stability frame was more widely distributed across the Politics section. It is not only that the words “Vučić” or “stability” were repeated many times in a few texts. They appeared in a larger number of texts. Such a pattern is consistent with the interpretation that stability functioned as a broader and more durable political frame.
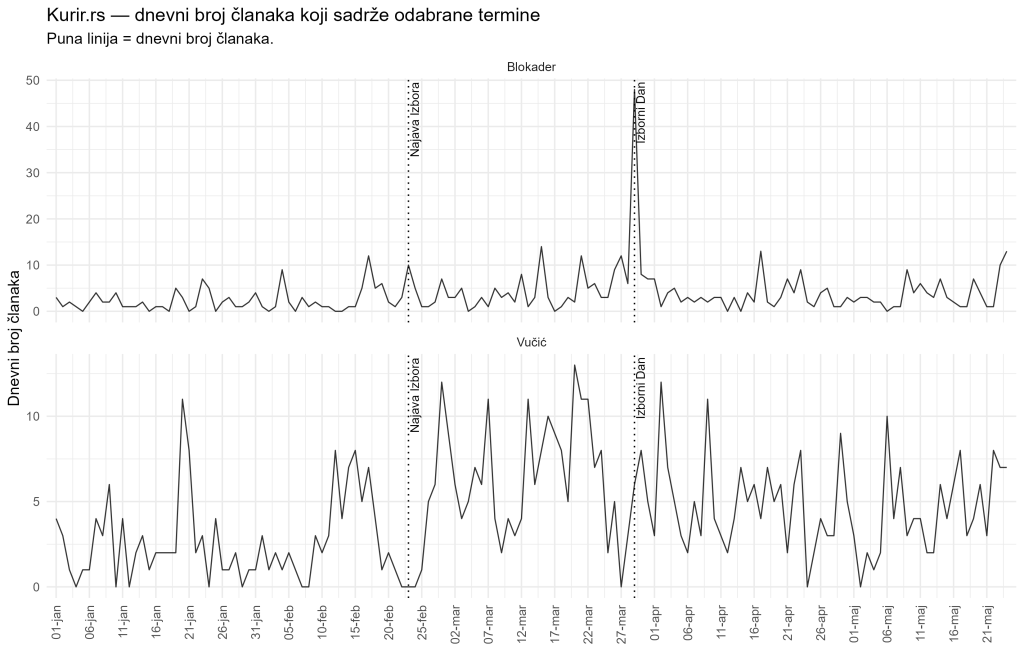
Intuitively, article count tells us about the reach of a frame within the analysed section. If total mentions measure volume, article counts measure spread. In this analysis, both indicators point in the same direction for “Vučić AND Stability”: it has higher volume and broader article presence. However, this still does not tell us how intensively each frame was repeated within the articles. For that, we need the saturation measure.
4. Saturation: how often the frame was repeated inside articles
Saturation measures how many times a given group of terms appears, on average, per article in which it appears at all. It is calculated simply: the number of term mentions is divided by the number of articles containing those terms. If a term appears 20 times in 4 articles, saturation is 5. If it appears 20 times in 20 articles, saturation is 1. The total number of mentions is the same, but the structure of repetition is completely different.
In this case, average saturation for “Blockaders AND Chaos” is 9.97 mentions per article. For “Vučić AND Stability”, it is 9.41 mentions per article. The difference is not large, but it is interesting. Although “Vučić AND Stability” is more frequent in total volume and appears in more articles, “Blockaders AND Chaos” has slightly higher average saturation.
This means that when the negative frame appears in an article, it is, on average, repeated at least as intensively, and even somewhat more intensively, than the stability frame. This finding says nothing about the tone of each individual article or about editorial intent. But it shows that “Blockaders AND Chaos” is not merely a rare or incidental frame. When it appears, it is often repeated within the same textual space.
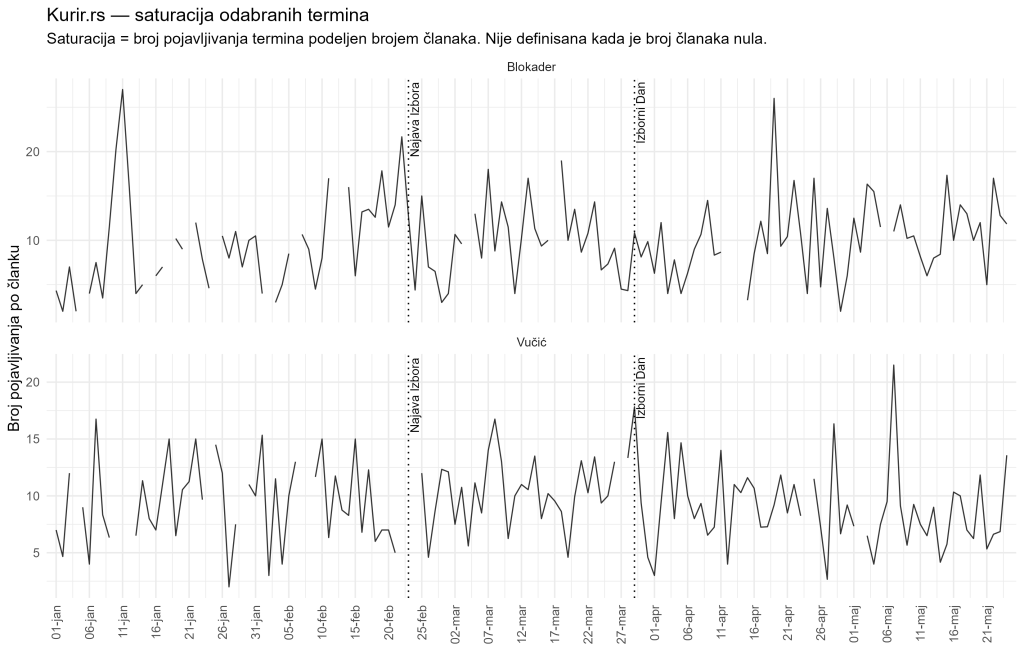
Saturation should be interpreted carefully. It depends on the number of articles in which the terms were found and does not include days when the terms do not appear. It also does not measure the total length of articles. A short article and a long article are treated equally if both are recorded as articles. Still, as an intuitive measure of repetition, saturation is useful. It shows that political framing is not only a question of presence or absence, but also of internal intensity.
5. Changes across subperiods: what happens after the election announcement
The most important descriptive insight comes from dividing the observed period into three politically meaningful subperiods. The first is the period before the official election announcement, before 23 February 2026. The second is the period from 23 February to 29 March, including both the announcement and election day. The third is the period after election day.
For “Blockaders AND Chaos”, the average daily count before the election announcement was 22.81. In the period from the announcement to election day, it increased to 52.34. After election day, it was 36.73. This means that the frame more than doubled between the announcement and election day, and then remained above its initial level after the election.
For “Vučić AND Stability”, the average daily count before the election announcement was 26.17. In the period from the announcement to election day, it increased to 64.66. After election day, it was 42.57. Here, too, we see a very similar structure: a strong increase after the election announcement and a post-election level that remains higher than the pre-announcement average.
Table 2. Average daily mentions by subperiod for both frames
| Term | Subperiod | Start | End | mean term count | total term count | mean article count | mean saturation | n days |
|---|---|---|---|---|---|---|---|---|
| Blokader | After Election Day | 30/03/26 | 24/05/26 | 36.7 | 2057 | 3.7 | 10.3 | 56 |
| Blokader | Announcement to Election Day | 23/02/26 | 29/03/26 | 52.3 | 1832 | 5.6 | 9.9 | 35 |
| Blokader | Before Announcement | 1/01/26 | 22/02/26 | 22.8 | 1209 | 2.2 | 9.6 | 53 |
| Vučić | After Election Day | 30/03/26 | 24/05/26 | 42.6 | 2384 | 4.7 | 8.8 | 56 |
| Vučić | Announcement to Election Day | 23/02/26 | 29/03/26 | 64.7 | 2263 | 6.1 | 10.6 | 35 |
| Vučić | Before Announcement | 1/01/26 | 22/02/26 | 26.2 | 1387 | 2.6 | 9.3 | 53 |
This is the central finding of the second part of the series. It shows that both frames become much more intense after the official election announcement. In other words, the change is not limited to election day itself. There is a broader campaign period in which both the negative frame “Blockaders AND Chaos” and the positive frame “Vučić AND Stability” are used much more frequently than before.
Intuitively, here we are not looking only at a single daily spike, but at a change in the average level. If the average daily count after the election announcement is much higher than before the announcement, it means that the frame became a more regular part of political language during that period. This is a meaningful finding for media monitoring: election campaigns are visible not only in official slogans, but also in changes in the frequency of particular expressions.
6. Election windows: different dynamics of the two frames
In addition to the three broader subperiods, the analysis also examines narrower election windows around 29 March. This allows us to see whether intensity increased evenly or whether there were particular days and shorter periods with exceptionally high values.
For “Blockaders AND Chaos”, the most visible result is election day itself. On that day, there were 521 mentions in 48 articles. This is an exceptional spike compared with other days. Because of this value, an ordinary event-window graph can become difficult to read, since one bar dominates the scale. For public presentation, it is therefore useful to use a graph in which election day is separated or shown apart from the other windows.
For “Vučić AND Stability”, the pattern is different. This frame shows strong growth in the broader pre-election period, especially in the windows from 30 to 15 days and from 14 to 8 days before the election. Election day is also elevated, but it is not an extreme outlier in the same way as “Blockaders AND Chaos”. This suggests that the stability frame functions more as a continuous campaign-period frame, while the chaos frame shows a sharper election-day explosion.
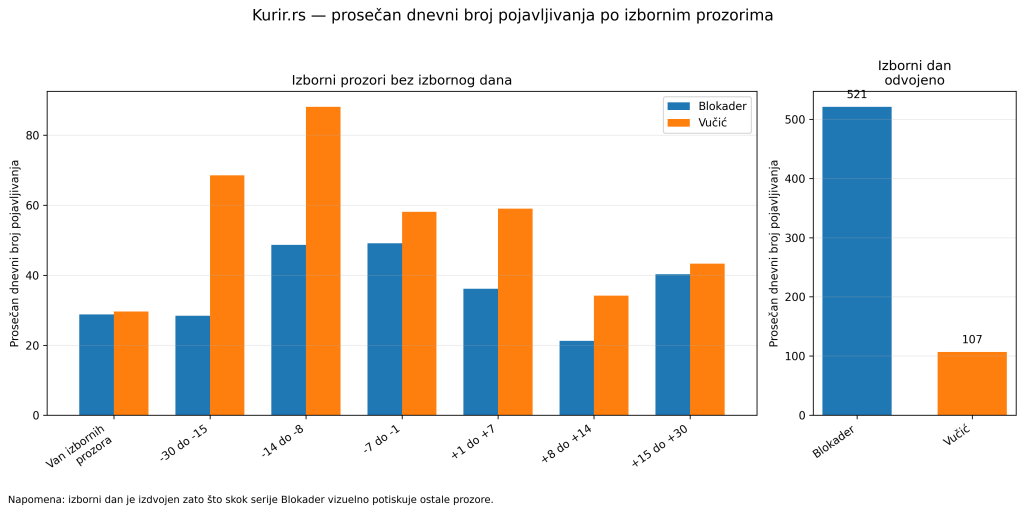
This result is one of the most important for interpretation. If we looked only at total numbers, we would conclude that “Vučić AND Stability” is the more frequent frame. If we looked only at election day, we would conclude that “Blockaders AND Chaos” is the most dramatic frame. Both statements are true, but they refer to different aspects of the data. The first concerns total volume; the second concerns temporal concentration.
That is why it is important not to reduce the analysis to one question: “Which frame had more mentions?” A better question is: “Which frame was broader and more persistent, and which was more explosive and tied to politically sensitive dates?” The descriptive results suggest a clear answer: stability is the broader frame, while chaos is the sharper and more volatile frame.
7. Highest-count days: where context should be examined
The table of highest-count days shows which dates should be checked qualitatively. For “Blockaders AND Chaos”, by far the highest day is 29 March 2026, election day, with 521 mentions. The next highest days are much lower. This confirms that election day is truly exceptional for this frame, not merely one of several similar high days.
For “Vučić AND Stability”, the highest days are more spread out across February, March, and early April. This is consistent with the earlier finding that this frame does not depend on a single election-day spike, but functions as a more durable campaign language. The highest days for this frame appear in different parts of the pre-election and immediate post-election period.
Table 3. Highest-count days for both term groups
| Term | Date | term count | article count | saturation | days to announcement | days to election |
|---|---|---|---|---|---|---|
| Blokader | 29/03/26 | 521 | 48 | 10.9 | 34 | 0 |
| Blokader | 17/02/26 | 162 | 12 | 13.5 | -6 | -40 |
| Blokader | 17/04/26 | 158 | 13 | 12.2 | 53 | 19 |
| Blokader | 24/05/26 | 154 | 13 | 11.8 | 90 | 56 |
| Blokader | 15/03/26 | 131 | 14 | 9.4 | 20 | -14 |
| Vučić | 7/03/26 | 154 | 11 | 14.0 | 12 | -22 |
| Vučić | 28/02/26 | 148 | 12 | 12.3 | 5 | -29 |
| Vučić | 21/03/26 | 144 | 11 | 13.1 | 26 | -8 |
| Vučić | 20/03/26 | 129 | 13 | 9.9 | 25 | -9 |
| Vučić | 15/02/26 | 120 | 8 | 15.0 | -8 | -42 |
This table should not be the end of the analysis, but a starting point for qualitative reading. Statistics can show that a given day was unusually high. But to understand why, we need to examine what happened on that day: which articles were published, which headlines were used, whether the count was driven by one event, several connected texts, or special editorial attention. In this sense, descriptive statistics do not replace reading the texts. They help us know which texts and which days deserve closer reading.
8. What the descriptive results show, and what they do not yet prove
The descriptive results give us several firm findings. First, both rhetorical frames intensify substantially after the official election announcement. Second, “Vučić AND Stability” has a higher total number of mentions and appears in more articles. Third, “Blockaders AND Chaos” has slightly higher average saturation and by far the most pronounced election-day spike. Fourth, the two frames have different temporal dynamics: stability is broader and more persistent, while chaos is more volatile and strongly concentrated on election day.
However, these results do not yet prove that the differences are statistically significant in a formal model. They do not control for weekday effects, they do not solve the problem of excess variability in count data, and they do not by themselves explain the causes of change. If something increases after the election announcement, that is an important temporal pattern, but it is not automatically proof that the announcement was the only cause of the increase.
That is why the next step is formal modelling. In the third part of the series, we will use models for count time series. These models are needed because daily term mentions are not ordinary continuous variables. They are count data: non-negative integers, often highly variable and sometimes marked by large spikes. In such a situation, ordinary linear regression is not the best tool.
The third part will therefore explain what a Poisson model means intuitively, why overdispersion matters, why the negative binomial model often fits such data better, and how incidence rate ratios are interpreted. The descriptive findings from this part will serve as the starting point: the models will test whether the patterns we see in tables and graphs remain visible in a more formal statistical framework.
The conclusion of this second part is that both political frames intensify during the election period, but not in the same way. “Vučić AND Stability” is more frequent and more widely distributed. “Blockaders AND Chaos” is less frequent in total, but intense, repetitive, and especially explosive on election day. This difference between volume and explosiveness will be central to the interpretation of the whole series.

Director of Wellington based My Statistical Consultant Ltd company. Retired Associate Professor in Statistics.
Has a PhD in Statistics and over 45 years experience as a university professor, consultant, international researcher and government advisor.