Part I showed how the same set of interviews can generate different percentages depending on the denominator, weighting, and target population. Now we reach the more difficult stage: the point at which a survey stops merely measuring the present and starts making assumptions about the future.
This is where turnout models, likely voters, fieldwork timing, and the famous “margin of error” enter the story. Public discussion sometimes treats ±3% as a statistical warranty: if that number appears on the label, the election result is expected to fall inside it, and if it does not, somebody must be incompetent or dishonest.
Statistics never provided that warranty.
The moment we select “likely voters”, we are already forecasting
A survey can correctly measure current political preferences, but the election is not decided by everyone who holds a preference. It is decided by those who actually vote.
Polling organisations therefore often try to identify likely voters. They may use stated turnout intention, previous voting, political interest, age, registration status, or other characteristics. Some exclude respondents below a threshold, some weight them by estimated turnout probability, and others use more elaborate models.
Once that happens, the poll is no longer simply a photograph of current preferences. A small forecast of future behaviour has been inserted into the estimate.
This matters because the same political answers can generate different party percentages if supporters of different lists are assigned different turnout probabilities. No respondent has changed preference. The model of who will arrive at the ballot box has changed.
Ipsos on 22 October: a poll, a turnout model and a projection in one package
Ipsos’s final pre-election release provides an unusually useful example. The research covered 3,624 respondents between 20 and 22 October. Ipsos stated that turnout was estimated on the full sample, while electoral-list percentages were calculated among decided respondents, people who said which list they intended to support. The final estimate also incorporated an assumption that 2.5% of ballots would be invalid. The commissioner was the Aleksandar Vučić – United Serbia electoral list.
We are therefore no longer dealing with one raw polling percentage. We have different estimands combined with additional forecasting assumptions. Ipsos estimated turnout at 64.7%, United Serbia at 47.4%, the Student List at 40%, and Ivica Dačić’s list at 3.2%. It also published statistical intervals: 45.3–49.5% for United Serbia and 37.9–42.1% for the Student List.
The preliminary Republic Electoral Commission result based on 97.56% of processed polling stations, however, put the Student List at 52.71% and United Serbia at 39.17%.
Both leading-party outcomes were far outside the published Ipsos intervals.
That is an important methodological event. But “Ipsos lied” or “Ipsos does not know how to poll” is not an analysis. The first question is what those intervals were actually designed to represent.
Margin of error is not comprehensive insurance for a poll
The classical sampling margin describes random variation created because we interview a sample rather than the entire population. It does not guarantee that the right population was covered, that non-respondents resemble respondents politically, that weights are correct, that question wording has no effect, that turnout was predicted correctly, or that public opinion will not change after fieldwork.
Sampling error is therefore part of total survey error. It is not a synonym for it.
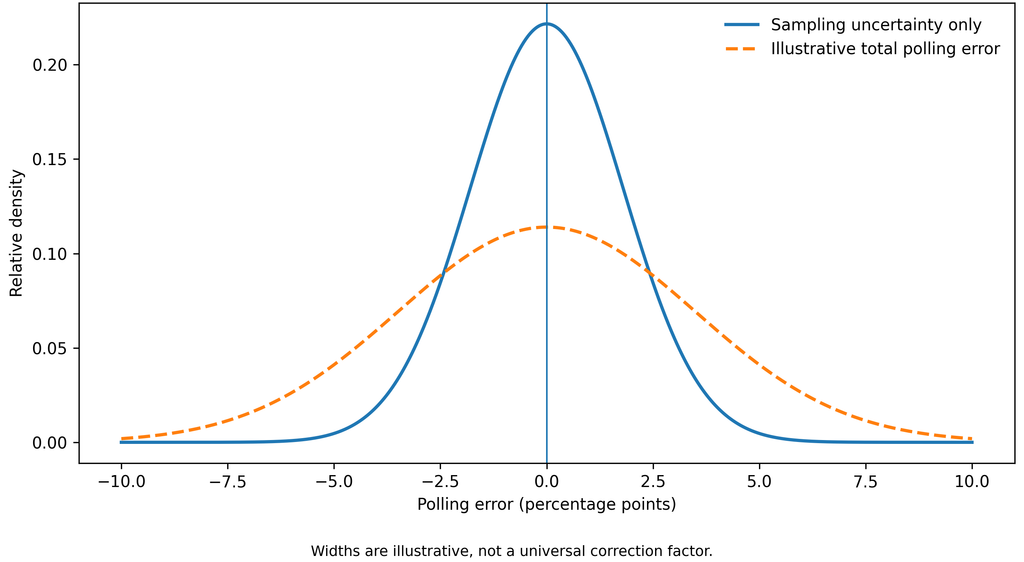
Figure 4.3. The sampling margin is only one component of total polling uncertainty. The wider distribution is an illustration of additional uncertainty, not a universal correction factor.
This is why the final Ipsos estimate deserves serious post-election investigation. The main problem may have been coverage, differential non-response, turnout assumptions, unusual late mobilisation, or some combination. The miss tells us that total uncertainty was not adequately represented by the published interval. It does not, by itself, identify the mechanism.
That is the difference between analysis and judgement.
“95% confidence” needs careful language
Ipsos’s release described the intervals as providing, with “95% certainty”, upper and lower boundaries within which the final election result should fall. That wording illustrates why it is essential to distinguish an interval describing sampling uncertainty from a predictive interval for a future election outcome.
If an interval incorporates only sampling variation, it cannot by itself guarantee where the final election result will fall. The election outcome also depends on future turnout, late changes, non-response, coverage, and systematic errors shared across polls.
More responsible public wording would identify the interval precisely: a sampling-based interval under the stated design, or, if it truly is predictive, an interval whose model explicitly includes additional sources of forecasting error.
Statistical precision does not become stronger merely because it is displayed to one decimal place and followed by “95%”.
A survey measures a fieldwork period, not a photographic instant
Another frequently overlooked source of confusion is time. A survey conducted over five days is not a photograph taken at noon on Friday. It combines interviews collected throughout those five days.
If a major campaign event occurs on day three, people interviewed before and after it are answering in different political environments. The headline estimate is a mixture of those moments.
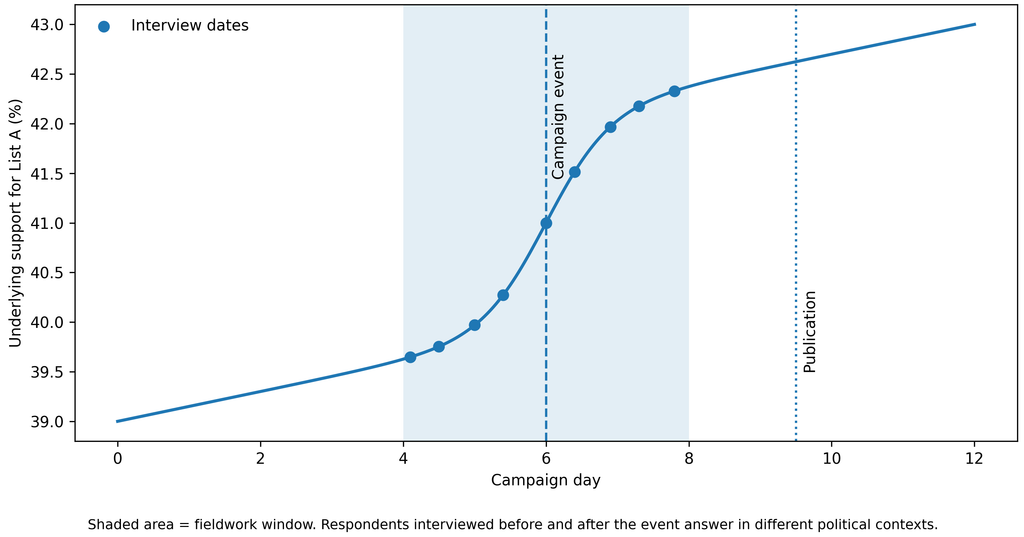
Figure 4.4. A poll measures a fieldwork period rather than a single instant. If underlying support changes during fieldwork, the published percentage combines respondents interviewed at different points in the political process.
This matters when we retrospectively line up CRTA, Faktor Plus, NSPM and Ipsos as if they all tried to forecast 25 October from the same date.
They did not.
CRTA completed fieldwork on 24 June. Faktor Plus on 20 September. NSPM on 5 October. Ipsos on 22 October. CRTA measured opinion four months before election day; Ipsos completed interviews three days before voting. Comparing their absolute errors without acknowledging timing is rather like comparing an October weather prediction issued in June with one issued on Friday for Sunday.
NSPM explicitly recognised this distinction and stated that its October release was not an “anticipation” or projection of the election result. That is a substantive methodological distinction, not merely a post-election excuse.
The “shy voter” is an attractive story, not a ready-made diagnosis
When polls miss, one of the first explanations usually offered is that supporters of some political side concealed their preferences. In Serbia, the story can easily be adapted to the politics of the observer. Some are certain that opposition voters remain silent because of fear. Others are certain that government supporters refuse to speak to “hostile” pollsters. Everybody seems to know exactly what the silent voters believe, except the data.
Preference concealment is a possible mechanism. But it can take several forms: deliberately reporting a different option, refusing the vote question, saying “don’t know” despite having a preference, or refusing the survey altogether. Those mechanisms are not statistically equivalent.
If their direction and magnitude can be estimated, they can enter a model with uncertainty. If not, they belong in sensitivity analysis rather than becoming a politically convenient correction.
A large polling miss does not automatically entitle the winning side to announce afterwards that it always knew where the hidden votes were.
Alo, Politika and Danas: the same number at different headline temperatures
Media framing changes what the public takes from a survey.
Alo headlined the Ipsos release by saying that Aleksandar Vučić – United Serbia was “convincingly in first place with 47.4 percent”. The article itself reproduced a substantial amount of methodological information, including the commissioner, mixed survey mode, and treatment of decided respondents. The issue is not fabricated data; it is that the word “convincingly” interprets the political meaning before the reader reaches the methodology.
Danas reported the same Ipsos estimate more descriptively and explicitly mentioned that United Serbia commissioned the poll, alongside the turnout estimate. Politika, reporting the Faktor Plus survey, used the formulation that SNS “would win 48.6 percent” if elections were held on Sunday.
Such language can easily transform a survey measurement into the appearance of a completed election forecast. Media need readable headlines, but professional responsibility requires that readers can still see where measurement ends and projection begins.
Even Vreme’s post-election headline, “Who lies and who doesn’t know how?”, is highly effective journalism but too narrow a methodological menu. A poll can miss without anyone lying, and it can occasionally hit the final result for the wrong reasons.
Who paid for the poll matters, but it is not an automatic verdict
Ipsos transparently stated that its final survey was commissioned by the Aleksandar Vučić – United Serbia list. That information belongs in the public record, and publishing it is good practice.
It does not automatically prove that the survey was manipulated. It does mean that a professional research organisation should maintain particularly clear boundaries between a client’s political interests and the analytical procedure. Sampling, weighting, question wording, turnout modelling, and uncertainty presentation should not change according to which client prefers a more attractive headline.
Exactly the same standard applies to research commissioned by civil-society organisations, opposition parties, international organisations, or media outlets. The commissioner is essential metadata. It is not a substitute for methodological analysis.
If we like CRTA’s result politically, that is not enough reason to trust it. If Faktor Plus produces a result we dislike, that is not enough reason to dismiss it. If Ipsos makes a large miss, the useful task is to reconstruct the mechanism of error rather than guess the motive.
A Poll Passport: less faith, more inspectable information
For this reason, the book proposes a simple device: a Poll Passport. It is not a one-to-ten quality score and not another index designed to prove that our preferred organisation is best. It is a standardised record of how a poll was produced.
For every survey we should be able to identify the pollster and commissioner, target population, geographic scope, sampling or recruitment procedure, interview mode, fieldwork dates, number of completed interviews, weighting variables, exact vote question, treatment of undecided respondents and refusals, any likely-voter model, and the precise meaning of the published uncertainty measure.
If some of that information is unavailable, we record the absence.
We do not record “conspiracy”.
That alone could cool Serbian polling debates considerably. Instead of “this poll is fake because I dislike it”, discussion could say: “the treatment of undecideds is not disclosed”, “the weighting procedure is unavailable”, or “the interval represents sampling error only”.
Less dramatic.
Much more useful.
After 25 October, the key question is not merely who missed
The preliminary election result shows that some final public estimates contained very large errors. Those misses deserve serious investigation. But a proper post-election methodological review should ask where the error originated: coverage, non-response, weighting, undecided voters, turnout modelling, timing, or several mechanisms acting together.
If we merely rank pollsters by distance from the final result, we will learn who happened to be closest this time.
If we understand why, we may build a better forecast next time.
That is a much more ambitious objective.
And much more useful than another league table of winners and losers.

Director of Wellington based My Statistical Consultant Ltd company. Retired Associate Professor in Statistics.
Has a PhD in Statistics and over 45 years experience as a university professor, consultant, international researcher and government advisor.