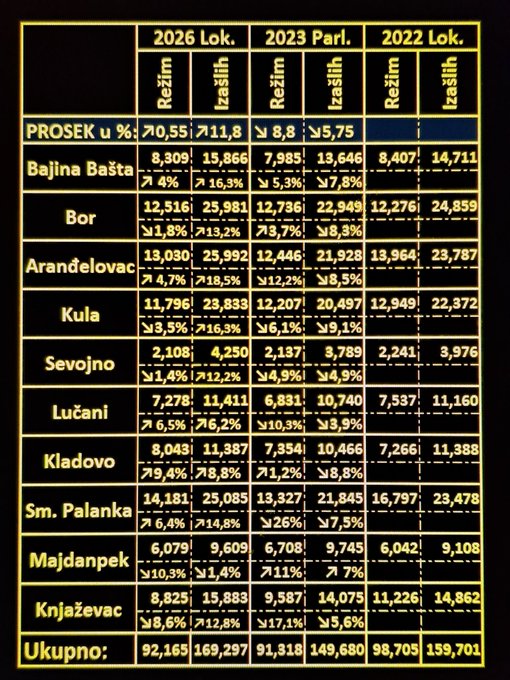
In an earlier blog post, I argued that raw vote totals are a weak instrument for answering one of the most common post-election questions: did the ruling party gain or lose support? A commentator on X had shared a table with local-election results across ten municipalities, and the immediate temptation was to compare only absolute numbers. But raw votes do not live in a vacuum. They sit inside a broader electoral context defined by turnout, electorate size, and the performance of political competitors. That is why a better reading requires relative indicators, not only totals.
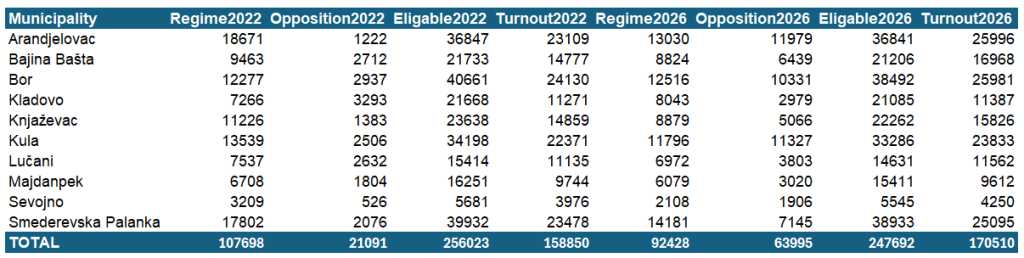
I checked the data sent to X based on the RIK report, corrected where necessary and added new ones. I completed the data from the last two election cycles in 10 local elections by adding the results of the opposition. I modified the sent table as follows. For example in the 2026 elections in Aranđelovac, the ruling party coalition consisted of the following parties: SNS, SPS, PUPS, SRS, SDPS, PS, SSZ, SNP, ZS, JS. In the 2022 elections, the parties performed mostly independently. In order to be able to compare the results of the elections in these two election cycles, I added up the results in 2022 of those parties that were in the coalition in 2026. This was the case with the parties: SNS, SPS – JP, SSZ, ZS. I acted similarly in all ten municipalities, both with regime and opposition parties and coalitions. The following table gives all the results in these two election cycles.
Table 1: Results of local elections in 2022 and 2026
Note: Here you can download an Excel file and independently perform an analysis with new data in two election cycles.
Table 2 gives a detailed description of the composition of the regime and opposition coalition in 2022 and 2026. So, if the party acted independently in 2022, and as part of the coalition in 2026, I added its votes in 2022 with the votes of those parties that were also members of the coalition in 2026.
Table 2. Composition of ruling and opposition coalitions
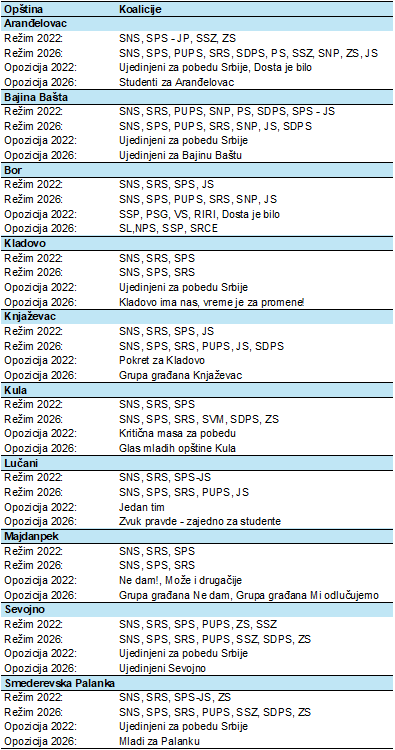
Note: Please let me know if I made a mistake in the classification of a party.
The Excel file includes both the ruling party and the opposition coalition. In the spreadsheet, ruling-party votes are entered as Votes1 / V1, while opposition votes are entered as Votes2 / V2. This allows us to move beyond the narrow question of how the ruling side changed in isolation and instead compare its movement with that of its main competitor.
That changes the analytical horizon considerably. We can still ask whether the ruling side gained or lost support, but now we can ask it in several more meaningful ways. Did the ruling side gain raw votes? Did it gain a larger share of those who turned out? Did it convert a larger portion of the eligible electorate into support? And did its position improve more, or less, than that of the opposition? These are not identical questions, and they do not always produce identical answers. That is precisely why this broader framework is more useful.
The first reason raw totals are not enough is simple. A party can lose votes and still improve its relative standing if turnout falls even more sharply. It can gain votes and still weaken politically if turnout rises faster and the opposition gains even more. In other words, raw vote change is only the outer shell of the problem. It tells us what happened numerically, but not what happened electorally. To say something more substantial, we need ratios.
This is where the key indicators in the spreadsheet matter. The file allows us to compare two election cycles using both absolute and relative measures. The raw differences remain useful. Difference Votes1 and %Difference Votes1 show whether the ruling side won more or fewer votes than before. Difference Votes2 and %Difference Votes2 do the same for the opposition. Difference Turnout and %Difference Turnout show whether more or fewer citizens participated. These indicators matter because they establish the basic movement of the electorate.
But the real analytical value lies in the ratios. V1/E tells us what share of the eligible electorate voted for the ruling side. V2/E tells us the same for the opposition. These indicators are important because they anchor the analysis in the total electorate, not only among those who showed up. By contrast, V1/T and V2/T tell us what share of those who turned out voted for the ruling side or the opposition. These indicators are politically sharper, because they tell us who was winning among actual participants. Finally, the differences in these measures — Difference V1/E, Difference V2/E, Difference V1/T, and Difference V2/T — show whether either side expanded or contracted its reach relative to the electorate and relative to turnout.
The electorate itself was broadly stable across these municipalities. Eligible voters declined modestly almost everywhere, and in the aggregate the eligible electorate fell by just 3.25 percent. That means the size of the pool from which votes could be drawn changed, but not dramatically. Turnout, by contrast, moved in the opposite direction: the total number of those who voted rose by 7.34 percent. This is already an important contextual fact. It means the 2026 local elections were not held in a lower-participation environment. More people voted overall. That makes raw vote losses more serious, not less, because they occurred despite a larger pool of participants.
And that is exactly what happened to the ruling side. In the aggregate, Votes1 fell from 107,698 to 92,428, a loss of 15,270 votes, or 16.5 percent. The opposition, meanwhile, rose from 21,091 to 63,995, an increase of 42,904 votes, or 204 percent. These numbers alone already tell a very different story from one in which the ruling side could plausibly claim expansion. But the relative indicators make the contrast even sharper.
At the city-wide aggregate level, the ruling side’s share among the eligible electorate, V1/E, fell from 42.07 percent to 37.32 percent, a drop of 4.75 percentage points. The opposition’s share among eligible voters, V2/E, rose from 8.24 percent to 25.84 percent, an increase of 17.60 percentage points. Among those who turned out, the ruling side’s share, V1/T, dropped from 67.80 percent to 54.21 percent, a decline of 13.59 percentage points. The opposition’s share among turnout, V2/T, rose from 13.28 percent to 37.53 percent, an increase of 24.25 percentage points. Taken together, these figures leave very little ambiguity: the ruling side lost ground, and the opposition gained a great deal of it.
The municipality-by-municipality picture confirms the same pattern, though with different intensity.
In Aranđelovac, the ruling side lost 43.3 percent of its raw votes, while the opposition increased its vote more than eightfold. Turnout rose by 12.5 percent, so this was not a case in which a shrinking electorate explains the ruling decline. The ruling share among eligible voters fell by 15.3 percentage points, from 50.7 percent to 35.4 percent, while the opposition share among eligible voters rose by 29.2 points. Among turnout, the ruling side fell from 80.8 percent to 50.1 percent, while the opposition jumped from 5.3 percent to 46.1 percent. This is not a marginal shift. It is a political reversal.
In Bajina Bašta, the ruling side lost only 7.2 percent of its raw votes, but the opposition rose by almost 58 percent and turnout increased by 14.8 percent. The ruling side’s share among turnout fell by 12.0 points, while the opposition’s rose by 19.6 points. The ruling side still remained ahead, but its dominance weakened substantially.
In Bor, the raw numbers alone might look ambiguous because the ruling side slightly increased its vote, by about 1.9 percent. But the opposition rose by 71.6 percent, and turnout rose by 7.7 percent. Once the relative measures are examined, the ambiguity disappears. The ruling share among turnout fell by 2.7 points, while the opposition share rose by 27.6 points. In other words, a tiny gain in raw votes did not translate into stronger competitive standing.
In Kladovo, the ruling side is the clear exception in this dataset. It increased raw votes by 9.7 percent, while the opposition fell by 10.5 percent and turnout barely changed. Here the ruling side improved both among eligible voters and among those who turned out. Its turnout share rose by 6.2 points, while the opposition share fell by 3.1 points. If one asks where the ruling side truly gained support, Kladovo is the clearest answer.
In Knjaževac, the ruling side suffered one of the harshest reversals. Raw votes fell by 26.4 percent, the opposition rose by 72.7 percent, and turnout increased by 6.5 percent. The ruling share among turnout collapsed by 19.4 points, while the opposition gained 22.7 points. The same pattern appears when measured against the eligible electorate. This is a strong loss.
In Kula, the ruling side lost 14.8 percent of raw votes, while the opposition rose by nearly 78 percent. Turnout grew by 6.5 percent. The ruling share among turnout fell by 11.0 points, and the opposition’s rose by 36.3 points. Relative to the electorate, the ruling side lost 4.15 points, while the opposition gained 26.7 points. This is another major shift against the ruling bloc.
In Lučani, the ruling side lost 8.1 percent of raw votes, the opposition gained 30.8 percent, and turnout rose by 3.8 percent. The ruling share among turnout fell by 7.4 points, while the opposition rose by 9.3 points. The movement is not as dramatic as in Knjaževac or Kula, but it is still clearly negative for the ruling side.
In Majdanpek, the ruling side lost 10.3 percent of raw votes, while the opposition rose by 40.3 percent and turnout fell slightly by 1.35 percent. Even here, where turnout was lower, the ruling side still lost both among the eligible electorate and among participants. The ruling share among turnout dropped by 5.6 points, while the opposition rose by 12.9 points.
In Sevojno, the ruling side lost more than half of its raw vote, while the opposition rose by 72.4 percent and turnout rose by 6.9 percent. The ruling share among turnout fell by 31.1 points, from 80.7 percent to 49.6 percent. The opposition rose by 31.6 points. This is one of the most dramatic reversals in the entire table.
In Smederevska Palanka, the ruling side lost 25.5 percent of raw votes, the opposition gained 70.9 percent, and turnout increased by 6.9 percent. The ruling share among turnout fell by 19.3 points, while the opposition rose by 19.6 points. This is another clear and substantial loss.
The overall pattern is therefore not difficult to read. Out of ten municipalities, the ruling side shows a clear competitive improvement only in Kladovo. In all the other municipalities, it loses ground in the more meaningful relative measures, particularly when we look at V1/T. That matters because these are local elections compared with local elections, so the comparison is methodologically much more defensible than comparing local with parliamentary contests. The ruling side was not simply losing raw votes in many places; it was also losing its share of the active electorate, while the opposition was expanding sharply.
The addition of opposition data improves the analysis substantially. In the previous version, one could say that the ruling side lost support, but one could not fully place that loss in competitive context. Now one can. And what becomes visible is that this was not merely a story of ruling-party decline. It was also a story of opposition expansion. The relative indicators show not only that the ruling side weakened, but that the opposition often gained at a much faster pace than the ruling side declined. In electoral politics, that matters greatly. Elections are not scored in isolation. They are contests of relative position.
This also shows why V/E and V/T should be used together. V/T is the sharper competitive indicator. It tells us who is winning among those who actually voted. V/E is the more conservative structural indicator. It tells us how much of the total electorate each bloc truly mobilized. In this dataset, both indicators point in the same direction. The ruling side lost on both. But the scale of loss looks much steeper in V/T than in V/E, because turnout increased overall. That is precisely why both are worth reporting.
There is also a practical dimension to this exercise. The attached Excel file, which can be published alongside the blog post, is reusable. It can serve as a template for two-election-cycle analysis with other municipalities or other election pairs, provided the appropriate data are entered into the right columns. In practice, all that is needed is to enter Registered/Eligible voters (Serbian: Registrovani/Upisani), Votes1 for the ruling side (Serbian: Režim), Votes2 for the opposition (Serbian: Opozicija), and Turnout (Serbian: Izlaznost). Once those values are entered, the spreadsheet automatically calculates absolute changes, percentage changes, and the more informative relative indicators based on turnout and eligible voters.
Of course, even this richer framework could be extended further. With more detailed party-level data, one could disaggregate the opposition. With additional contextual variables, one could test whether these changes were stronger in rural or urban municipalities, in smaller or larger ones, or under different local political conditions. But even without that, the present table already allows a much better answer than raw votes alone ever could. The main conclusion is straightforward. If the question is whether the ruling side gained or lost support in these ten municipalities, the answer is clear: it lost support overall, and it lost it in almost every municipality, with Kladovo as the major exception. This conclusion is not based only on raw vote decline. It is supported by turnout-adjusted and electorate-adjusted indicators, and it is reinforced by direct comparison with opposition performance. In short, once the results are read properly, through relative rather than purely absolute measures, the 2026 local elections in these ten municipalities tell a much less favorable story for the ruling side than raw numbers alone might suggest.
Director of Wellington based My Statistical Consultant Ltd company. Retired Associate Professor in Statistics.
Has a PhD in Statistics and over 45 years experience as a university professor, consultant, international researcher and government advisor.