This post continues my series based on the election-forecasting book I am currently preparing. As before, the aim is not to serialise the manuscript chapter by chapter, but to take selected ideas out of the academic setting and expose them to public discussion before the final version is locked. I hope the series remains useful both to election specialists and to readers who simply want to understand where the percentages appearing on television screens actually come from.
This time we begin with an apparently trivial puzzle. A survey says that a list has 38%. Another outlet, using the same interviews, reports 46%. A final table displays almost 48%. Nobody has changed their mind, not a single additional respondent has been interviewed, and no votes have been secretly added. Only the denominator, the weights, and assumptions about who is likely to vote have changed.
Welcome to polling methodology, where the same interviews can sometimes legitimately produce different headline numbers.
Forty-six percent, of whom?
Imagine a survey of 1,000 people. List A is chosen by 380 respondents, List B by 330, other lists by 110, while 120 are undecided and 60 refuse to state a preference. If all 1,000 respondents form the denominator, List A has 38%. If the undecided and refusals are removed, the same 380 supporters constitute 46.3% of the 820 people who named a specific choice.
Both calculations are mathematically correct. They are simply estimating different quantities.
If we then discover that younger people are underrepresented and introduce demographic weights, the percentage may move again. If we subsequently restrict the calculation to people judged more likely to vote, it can change once more. “List A has 46%” is therefore incomplete information. The first question should be: 46% of whom?
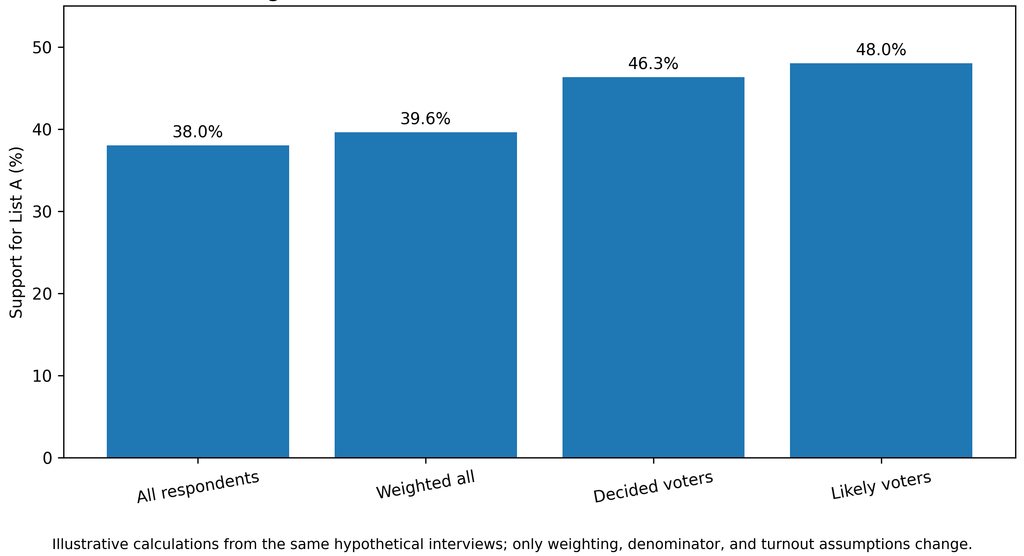
Figure 4.1. How 38% becomes 46%, and then 48%. The same hypothetical interviews generate different estimates when weights, denominators, and turnout assumptions change.
This is not statistical pedantry. Denominators became one of the central issues in Serbia’s most recent polling.
CRTA’s 44.9% is not 44.9% of all Serbian adults
CRTA’s survey conducted from 10 to 24 June 2026 reported that, among decided voters, 44.9% would support the Student List and 35.7% SNS. The same release stated that decided voters constituted 70% of respondents, while 12% were politically undecided and 9% said they would not vote. The survey used face-to-face interviews with a representative sample of 2,324 Serbian adults.
That means the statement “the Student List has 44.9%” is incomplete. More accurately, it had 44.9% among respondents who currently named a specific electoral choice. This neither diminishes nor enhances the Student List’s support. It simply tells the reader what was actually calculated.
The distinction matters because headlines tend to live much longer than methodological notes. A reader who sees only 44.9% can easily interpret it as support among all adults, all registered voters, or even as a forecast share on election day. Those are different quantities.
NSPM gave us a useful example of a visible denominator
NSPM’s telephone survey of 1,050 respondents, conducted between 25 September and 5 October, put the Student List at 44.5% and United Serbia at 42.7%. The table explicitly said the results were reported “without the undeclared”, while 18.3% of respondents were separately shown as undecided, not knowing, or unwilling to answer. Even more importantly, NSPM explicitly stated that this was a regular public-opinion survey, not an election-result projection.
That is useful methodological information. The reader knows that 44.5% is not a percentage of all 1,050 interviews and knows how large the excluded category was.
We can still debate the sample, telephone mode, questionnaire, commentary accompanying the release, or anything else. But at least we know what to debate. Transparency does not guarantee quality; it makes quality assessable.
A large N is not methodological holy water
Ipsos’s final pre-election survey is particularly useful for this discussion. It was conducted from 20 to 22 October with a very large sample of 3,624 respondents. Ninety percent of the interviews were conducted by telephone using fixed and mobile numbers, while 10% came from Ipsos’s online panel. The target population was the adult population of Serbia excluding Kosovo, and voters living abroad were also outside the survey population.
Already we can see why “N = 3,624” is not a complete description of quality. A large sample reduces random sampling variability, but it does not answer who could not enter the sample, who refused, how the telephone and online components were integrated, or how realised respondents were aligned with the target population.
To its credit, Ipsos published substantially more than the sample size. It described the mode, population, fieldwork dates, commissioner, and how several estimates were calculated. That transparency is precisely what makes methodological scrutiny possible.
The broader lesson is simple: a survey of 3,600 people is not automatically three and a half times “better” than one of 1,000. If a politically important group is systematically missing, interviewing thousands more people from the same imperfectly represented population does not solve the fundamental problem.
Probability, quotas and online panels: the label is not the verdict
Public discussion often assigns almost moral value to sampling labels. “Random sample” sounds scientific, “quota sample” sounds slightly suspicious, while “online panel” can make it sound as if the respondents were selected from a YouTube comments section.
Reality is more complicated.
A probability sample provides a strong theoretical basis for known selection probabilities, but it may perform badly if substantial politically differentiated non-response occurs. A quota sample may reproduce age, sex, and region very accurately while missing politically important characteristics not included in the quotas. A carefully calibrated non-probability online sample can sometimes outperform a poorly realised conventional design.
A survey should therefore be evaluated as a complete measurement system, not by one methodological label.
Weighting: extremely useful, but it cannot manufacture respondents
Suppose people aged 18–34 make up 20% of the target population but only 10% of the realised sample. If political preferences differ by age, the unweighted result may be distorted. A sensible solution is to give younger respondents more weight so their aggregate contribution better reflects the population.
This is a standard and often necessary procedure.
But weighting is not necromancy. If only a handful of young rural respondents were interviewed, giving them large weights does not magically reveal the political diversity of all young rural citizens who were never observed. Weighting redistributes information already present in the sample. It cannot create information that is absent.
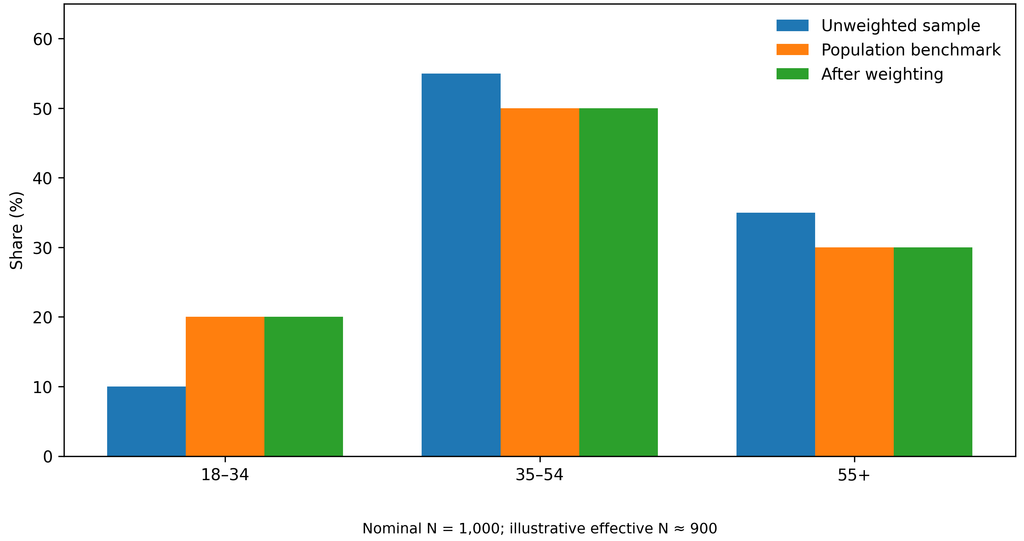
Figure 4.2. Weighting can improve alignment between the realised sample and the population, but unequal weights also reduce the effective amount of statistical information.
This introduces another quantity rarely seen in television graphics: effective sample size. A survey may contain 1,000 completed interviews, but if some respondents receive much larger weights than others, statistically it does not behave like 1,000 equally informative observations.
That does not mean weighting is undesirable. Often it is essential. It means only that “1,000 respondents” is not a magical description of how much information a survey contains.
Faktor Plus: what can and cannot be inferred from a media report
Faktor Plus’s September survey, conducted from 16 to 20 September on 986 respondents, was reported by Politika as placing United Serbia at 48.6% and the Student List at 37.1%. The report also gave an estimated turnout of 62%, with 22% saying they would not vote and 16% saying they did not know.
Those are useful facts, but the media report is not a complete methodological passport. From that article alone, a reader does not obtain a fully specified denominator for the party estimates, recruitment procedure, weighting details, and several other elements needed for a complete independent assessment.
That does not prove that the survey was methodologically poor, and certainly does not prove political manipulation. It supports only a much more modest conclusion: the public report does not allow us to verify everything we would ideally want to verify.
That distinction matters. Scientific criticism should say “this information is insufficient to evaluate X”, not “X was not published, therefore the poll was fake”.
Non-response: 20,000 of the wrong people can still be wrong
Modern surveys face another challenge: many people simply do not want to participate. A low response rate alone is not necessarily fatal. If those who refuse and those who participate have similar political preferences after appropriate adjustment, the final estimates may still be good.
The serious problem is differential non-response.
If supporters of one political side are much less likely to answer a phone call or face-to-face interviewer and that difference is not captured by weighting variables, the sample may look demographically elegant while remaining politically distorted. Increasing N is not a reliable cure. Twenty thousand unrepresentative respondents can provide a very precise estimate of the wrong population.
This is one of the central insights of the total-survey-error perspective: random sampling error is only one source of polling error.
Question wording is part of the data
When we ask people how they intend to vote, we are not downloading a fixed political file stored somewhere in their heads. Responses can depend on whether options are read aloud or volunteered, their order, what was asked immediately beforehand, and whether the respondent is talking to an interviewer or answering privately on a screen.
This does not mean respondents are unserious. It means measurement is an active process.
If a pollster changes from telephone to online collection in the middle of a campaign, an apparent three-point movement may represent political change, methodological change, or both. That is why the mode is not a footnote. It is part of the observation.
A poll is not a miniature election day
The main message of Part I is therefore straightforward: a poll is not a small election conducted several weeks early. It is a measurement system that uses a limited set of interviews to infer something about a much larger population.
Before declaring a percentage politically wonderful, disastrous, “real”, or “fake”, we should know at least four things: the target population, who actually entered the sample, how the interviews were weighted, and who remained in the denominator.
Only then can we seriously interpret the result.
Because sometimes there are not ten points of changing public opinion between 38% and 48%.
Sometimes there are ten points of methodology.

Director of Wellington based My Statistical Consultant Ltd company. Retired Associate Professor in Statistics.
Has a PhD in Statistics and over 45 years experience as a university professor, consultant, international researcher and government advisor.