Series: “Election Forecasting: Between Statistics, Politics, and Uncertainty” — Election Forensics
This post continues my series on election forecasting, written for both specialists and readers who do not spend their evenings thinking about sampling frames, turnout models, and predictive distributions. I am currently preparing a book on election forecasting, and these blog posts are also a way of putting some of its arguments into the public domain before the manuscript is final. Criticism is therefore welcome: if an argument is unclear, a distinction too technical, or an example misleading, that is exactly the kind of feedback that can improve the final book.
This time I will not begin with the question of who is leading the latest Serbian poll. Serbia already devotes enough collective energy to that question to power a medium-sized municipality. The more important question is: what exactly does it mean when a poll reports 42%, 45%, or 49%?
The chapter behind this post begins with two hypothetical countries in which professionally conducted surveys report exactly the same party support. The political environments, however, differ. The point is not that we should automatically add or subtract votes in one country. The point is that an identical number can be produced by different measurement and behavioural processes and can therefore contain different kinds of uncertainty. Glava 2
Serbia’s easiest methodology: I like the poll, therefore it is scientific
Serbian discussion of public-opinion research often relies on a remarkably economical quality-control procedure. If a poll produces the result we expected, it is serious research. If it does not, it is “fake”.
That word should not be used casually. Calling research fake is not the same as arguing that its sample is weak, that the questionnaire is poorly designed, that weighting is questionable, or that undecided respondents have been handled badly. “Fake” implies fabrication or deliberate falsification, and that requires evidence.
The rhetoric is not hypothetical. A commentary published on Politika’s website called CRTA’s July poll a “fake” survey and treated its large disagreement with Faktor Plus as evidence that CRTA had manipulated the result. On his own political website, Nebojša Bakarec similarly described the July NSPM poll as “comically fake”, again relying heavily on its divergence from Faktor Plus. Informer ran an even more direct headline declaring that the CRTA survey was fake.
CRTA, NSPM, Faktor Plus, or any other pollster can and should be criticised methodologically. But two polls producing different numbers is not evidence by itself that one was fabricated. It is the beginning of an investigation, not the conclusion.
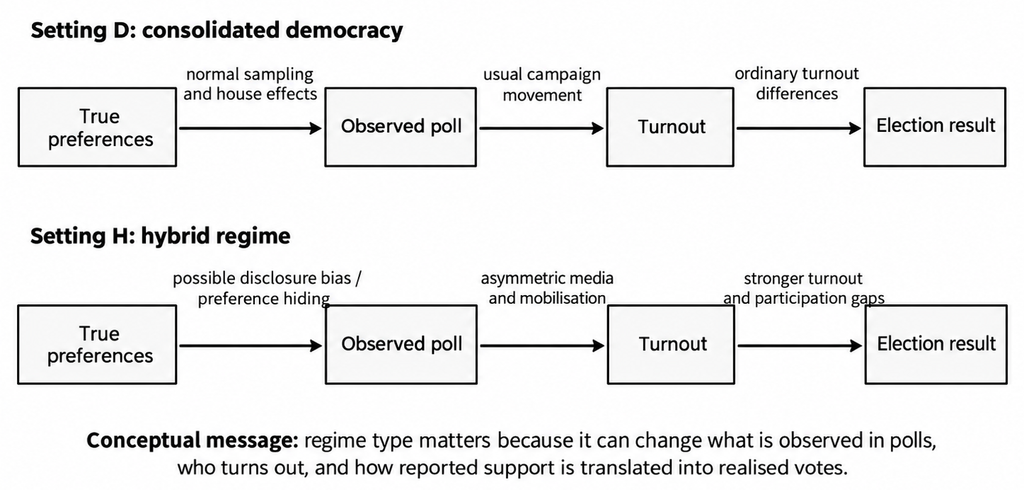
[Figure 2.1. Where regime type enters the forecasting chain]
The same country, very different numbers
Consider three real examples. CRTA’s survey conducted from 10 to 24 June 2026 reported, among decided voters, 44.9% for the Student List and 35.7% for SNS. Importantly, CRTA released substantial methodological information: 2,324 adult respondents, face-to-face CAPI interviewing, a three-stage stratified random sample, post-stratification, a 24% response rate, fieldwork dates, and an estimated margin of error.
Faktor Plus, using fieldwork from 16 to 20 September and a sample of 986 respondents, reported 48.6% for the SNS-led list and 37.1% for the Student List. Public reports gave the fieldwork period, sample size, and a turnout estimate, although one relatively detailed account explicitly noted that the commissioner of the poll had not been disclosed.
NSPM published a new survey on 20 October, based on telephone interviews with a representative sample of 1,050 respondents conducted from 25 September to 5 October. Among respondents reported without the undeclared category, the Student List received 44.5% and Aleksandar Vučić’s list 42.7%. At the same time, NSPM reported that 18.3% of respondents were undeclared, did not know, or did not want to say.
Those are strikingly different pictures. The politically convenient response is to choose one as truth and send the others to the ideological recycling bin. The more useful response is to ask why they differ.
The first question is not “Who is lying?” but “What was measured?”
A poll does not measure a political temperature floating somewhere above society. It records answers from people reached through a specific sampling procedure, during a specific period, through a specific interview mode, in response to specific questions.
A face-to-face survey and a telephone survey need not reach identical groups in identical ways. Different fieldwork dates mean that respondents were answering in different political environments. Different questionnaires may activate different considerations. Different weighting schemes can alter the final composition of the effective sample.
And one issue deserves special attention: undecided respondents and people who refuse to disclose a preference. If a headline says that a list has 44.5% among declared voters, that is not the same statement as saying that 44.5% of all adult citizens support that list. A reader who sees only the large number in the headline may have no reason to notice the distinction.
That is where the responsibility of both pollsters and media begins.
“I won’t say” is not the same as “I don’t know”
Chapter 2 separates several phenomena that political discussion regularly compresses into one category. A respondent may genuinely be undecided. They may have a preference but refuse to disclose it. They may participate in the survey but skip the vote-intention question. They may refuse the survey entirely. They may even report a preference different from the one they privately hold. These mechanisms are not statistically equivalent.
Genuine undecidedness mainly creates future uncertainty. Politically concentrated refusal to disclose can create measurement bias. Differential survey non-response can alter the composition of the sample itself. The claim that “we know who all the undecideds really support” is therefore not analysis. It is a political intuition looking for a spreadsheet.
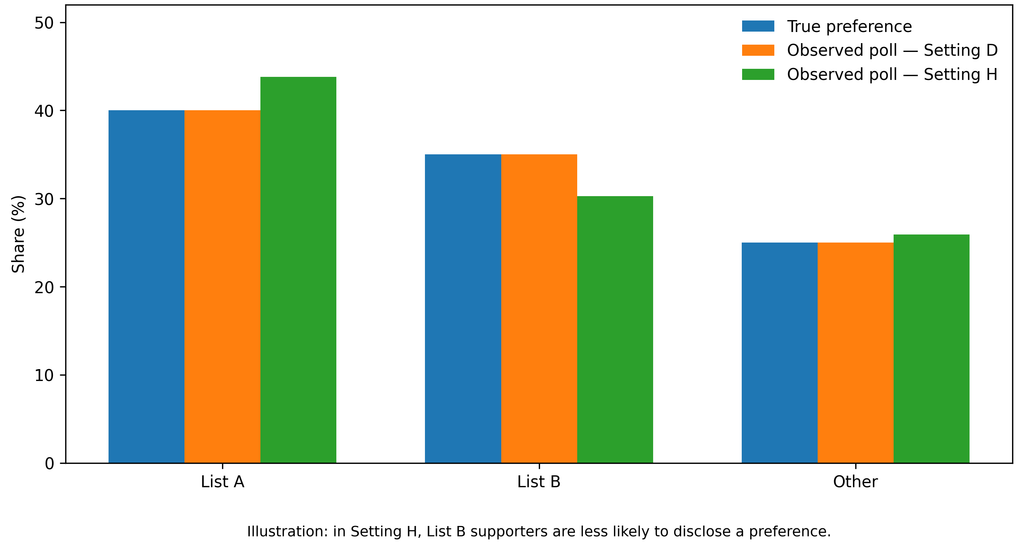
[Figure 2.2. Same true preferences, different observed poll]
A hybrid regime is not a “minus three points” button
Serbia’s political environment can be relevant to survey measurement. But that creates a second, symmetrical danger.
Describing a country as a hybrid regime does not entitle the analyst to subtract three, five, or seven percentage points from the governing party. Chapter 2 explicitly rejects that kind of political arithmetic. The proper sequence is institutional condition → possible mechanism → observable consequence → and only then, if evidence exists, a model parameter or sensitivity analysis.
Suppose we suspect that some opposition supporters are less willing to disclose their preferences. That is a hypothesis. We would want evidence that their refusal pattern actually differs, that the difference is not explained by age, education, region, or other characteristics, and ideally some validation of how those respondents later vote.
The same discipline applies in the opposite direction. We cannot simply assume that government supporters disclose more readily, or that most “don’t know / won’t say” respondents are hiding opposition support.
The direction of the effect should be measured, not politically selected.
Civil society does not get a methodological exemption
Methodological responsibility should not stop with criticism of pro-government outlets. Civil-society organisations, independent researchers, and critical media have exactly the same obligation.
CRTA deserves credit for publishing substantial methodological information with its June survey. That makes the research more assessable. But its public summary also says that support for the protests is “translating into potential votes” for the Student List. That may be a reasonable interpretation of the broader evidence, but the language sounds more causal than a single cross-sectional survey can easily establish by itself.
The standard should be symmetrical. If we ask Faktor Plus for fuller methodological disclosure, we should also ask CRTA to distinguish carefully between measured association and causal language. If we ask NSPM to explain its telephone sampling and treatment of non-response more fully, that is not a political attack on NSPM. It is ordinary scientific hygiene.
What should accompany every large percentage?
No television programme needs to become a graduate course in survey methodology. But public presentation should tell us who conducted and commissioned the survey, when fieldwork occurred, how many people were interviewed, how they were contacted, which population the sample represents, how undecided and non-responding participants were treated, and what the displayed percentage actually uses as its denominator.
“44% of all respondents”, “44% of likely voters”, “44% of decided voters”, and “44% after redistributing undecideds” are four different claims even if the graphic displays the same large number.
Polling organisations have an educational responsibility because they possess methodological knowledge that much of the audience reasonably does not. Media organisations have a similar responsibility because the headline may be the only part of the research that most citizens ever see.
In an already overheated political environment, removing methodological context is not neutral. A single percentage can rapidly become another piece of evidence that “the whole country” agrees with whatever we already believed.
From “fake poll” to a better question
The next time one poll shows one list at 48% and another produces the opposite ranking, try to survive ten seconds before declaring either a magnificent scientific truth or a conspiracy.
Ask instead: When was the fieldwork? Who was interviewed? How? Who did not answer? What is the denominator? Is this measuring current reported preference, or making a claim about election day?
Those questions are less exciting than “Who is lying?” They are also much more useful. Because sometimes 42% really is 42%. We simply need to know first, 42% of what?

Director of Wellington based My Statistical Consultant Ltd company. Retired Associate Professor in Statistics.
Has a PhD in Statistics and over 45 years experience as a university professor, consultant, international researcher and government advisor.