1. Local Context of the 2026 Elections in Kula
Kula is a Vojvodina municipality whose electoral terrain is shaped less by remoteness than by internal pluralism. The 2022 census and the 2025 statistical publication place it at about 35,600 inhabitants and 481 km², with the town of Kula itself significantly smaller than the municipality as a whole. This matters because Kula includes several larger settlements besides the municipal centre, so it is better understood as a multi-nodal local space than as a municipality dominated by a single settlement.
Its economic and social profile reflects that complexity. Official local investment materials emphasize agriculture and fertile black soil, while the municipality’s own public pages show a developed institutional structure and regular assembly activity. In Vojvodina municipalities of this kind, politics often runs through a mix of agriculture, local business, public services, and settlement-specific networks rather than through one dominant industrial centre. The presence of a mixed and socially differentiated settlement map makes it plausible to expect variation not only between town and countryside, but also among the municipality’s larger settlements.
The political field also appears plural rather than empty. Official pages identify Damjan Miljanić as president of the municipality and Velibor Milojičić as president of the assembly, while the run-up to the March 2026 elections drew unusual public attention: N1 reported a record number of accredited observers in Kula. For later forensic analysis, the key expectation is that Kula may display differentiated electoral signatures across several organized local centres, not just across a simple urban–rural divide.
2. Election lists and official result summary
The 2026 local elections in Kula were contested by five lists: Aleksandar Vučić – Kula, naša porodica!, Mladi za Kulu, Glas mladih opštine Kula, Rusinska lista, and Srpski liberali za zelenu Kulu.
Table 1. Official election result in Kula
| Electoral list | % votes | Mandates |
| Aleksandar Vučić – Kula, naša porodica! | 49.49 | 19 |
| Mladi za Kulu | 0.60 | 0 |
| Glas mladih opštine Kula | 47.53 | 18 |
| Rusinska lista | 0.27 | 0 |
| Srpski liberali za zelenu Kulu | 0.31 | 0 |
The official result shows an extremely compressed two-bloc contest. The ruling list won 49.49% of the vote and 19 mandates, while Glas mladih opštine Kula won 47.53% and 18 mandates. All remaining lists were electorally marginal and failed to enter the assembly. This is a crucial starting point for forensic interpretation because such a highly bipolar contest tends to amplify the statistical interplay between the winner and the principal challenger, while making the behavior of smaller lists politically secondary unless they occupy very specific territorial or strategic niches.
3. Analytical framework
This section applies the same multi-method election-forensics framework used in the earlier municipal analyses. It combines a correlation matrix, regression analysis, graphical analysis of turnout and vote shares across several election cycles, Klimek-style cumulative curves, election fingerprints, and Mebane’s finite-mixture model. The purpose is not to argue that any single indicator can independently prove electoral fraud. The purpose is to test whether distinct indicators converge and whether the structure of the local result appears more consistent with ordinary democratic competition or with a politically distorted environment. The Kula file is organized around the same seven substantive questions used in the earlier parts of the report.
Kula has 40 polling stations, which is methodologically important throughout. That is enough to allow meaningful local-level pattern recognition, but still small enough to require caution, especially for graphical methods and latent-class approaches such as election fingerprints, Klimek curves, and finite-mixture models. As in the Aranđelovac and Bajina Bašta sections, the correct interpretive standard is cumulative. No single small-sample indicator should be treated as decisive on its own. But if several methods point in a similar direction, the combined evidentiary weight becomes analytically significant.
4. Turnout and vote shares
Did higher turnout benefit the ruling party or the opposition?
4.1 Intuitive logic
In a free and fair election, turnout should not systematically operate as a one-sided political resource. Some polling stations naturally vote more heavily than others, but the critical forensic question is whether higher turnout consistently benefits the ruling party while reducing the opposition’s share. If that happens repeatedly and strongly, turnout ceases to look like a neutral measure of participation and begins to resemble an asymmetric channel of political mobilization.
4.2 Results and interpretation
The correlation matrix for Kula suggests that turnout was more politically meaningful than in Bajina Bašta, though still not as overwhelmingly structured as in the strongest anomaly cases. We shaded positive significant correlation coefficients in green, and negative significant ones in red. The ruling list’s share (%SNS) is positively correlated with turnout at r = 0.44, indicating that polling stations with higher turnout also tended to be polling stations where the ruling side performed better. The main opposition list (%Glas) shows the exact mirror image: r = −0.43 with turnout. This is already a noteworthy asymmetry. It suggests that higher turnout was associated with gains for the ruling side and losses for the main challenger. That is the broad direction that election forensics treats as suspicious when supported by additional evidence.
Table 2. Correlation matrix
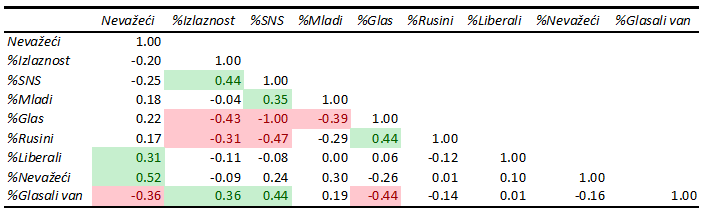
The central structure of the race is even more striking. The correlation between %SNS and %Glas is −1.00, an almost perfectly inverse relationship across polling stations. As in the earlier cases, this should not be misread as literal proof of one-for-one individual-level voter transfer. It is primarily a compositional property of an overwhelmingly bipolar contest. Still, the coefficient leaves no doubt that Kula’s electoral competition was sharply organized around the ruling list and Glas mladih opštine Kula as the principal opposition pole. The smaller lists were electorally marginal and did not significantly alter that basic structure.
Among the smaller lists, Mladi za Kulu has a moderate positive correlation with %SNS (r = 0.35), while Rusini are more clearly anti-correlated with the ruling side (r = −0.47) and positively correlated with %Glas (r = 0.44). These are interesting local patterns, but they should be read cautiously. The tiny electoral size of these lists makes them statistically unstable and politically ambiguous. The Liberal list has virtually no meaningful relationship with the major blocs (r = −0.08 with SNS; r = 0.06 with Glas). On the available statistical evidence alone, it would be excessive to classify any of these smaller actors with confidence as either genuine opposition auxiliaries or deliberate quasi-opposition formations. Such a judgment would require evidence beyond vote-share correlations.
The broader correlation environment also matters. Turnout is only modestly related to the other potentially suspicious variables. It is negatively correlated with the number of invalid ballots (r = −0.20) and with the percentage of invalid ballots (r = −0.09), while it is positively correlated with the percentage voting outside the polling station (r = 0.36). This is weaker than the Aranđelovac pattern, but stronger than Bajina Bašta. In Kula, turnout seems to sit in an intermediate position: it is not an entirely neutral participation measure, but neither is it so tightly bundled with every other suspicious indicator that it becomes self-evidently anomalous on its own. That is precisely why the graphical and regression evidence later becomes so important.
The overall substantive reading is therefore balanced but serious. Higher turnout in Kula appears to have been more favorable to the ruling side than to the main opposition. But this finding must be placed in a broader evidentiary frame. By itself, the correlation pattern is suggestive rather than decisive. Its forensic meaning depends on whether it is reinforced by the regression analysis and by the longer-run graphical comparison across election cycles.
4.3 Limitations and caution
Correlation is again only a screening tool. It does not establish causality, does not identify mechanism, and cannot distinguish between legal organizational advantage and illicit intervention. The perfect −1.00 relationship between SNS and Glas should be treated mainly as a compositional feature of a two-pole election. The smaller lists also remain too small to bear strong interpretive weight on their own. The correct use of the turnout correlations is therefore as part of a cumulative forensic assessment, not as a standalone verdict.
4.4 Conclusion
Yes, the Kula results support the conclusion that higher turnout was more favorable to the ruling list than to the main opposition. The key coefficients are r = 0.44 for turnout and %SNS, and r = −0.43 for turnout and %Glas. This is a meaningful forensic signal, though not as overwhelmingly self-sufficient as some of the stronger indicators examined later in the report.
5. Voting outside the polling station and vote shares
Did voting outside the polling station benefit the ruling candidate?
5.1 Intuitive logic
Voting outside the polling station is administratively legitimate but forensically sensitive. It reduces the transparency of ordinary polling-station procedures and opens more room for organizational control, especially where dependent or immobile voters are concerned. The key analytical question is whether this form of voting looks politically neutral or whether it disproportionately aligns with stronger ruling-party performance.
5.2 Results and interpretation
The correlation matrix clearly suggests that outside-the-polling-station voting in Kula worked more to the benefit of the ruling side than of the opposition. The percentage voting outside the polling station (%Glasali van) is positively correlated with %SNS at r = 0.44 and negatively correlated with %Glas at r = −0.44. These are moderate but clearly directional coefficients. They indicate that polling stations with more outside voting tended to record better results for the ruling list and weaker results for the main opposition.
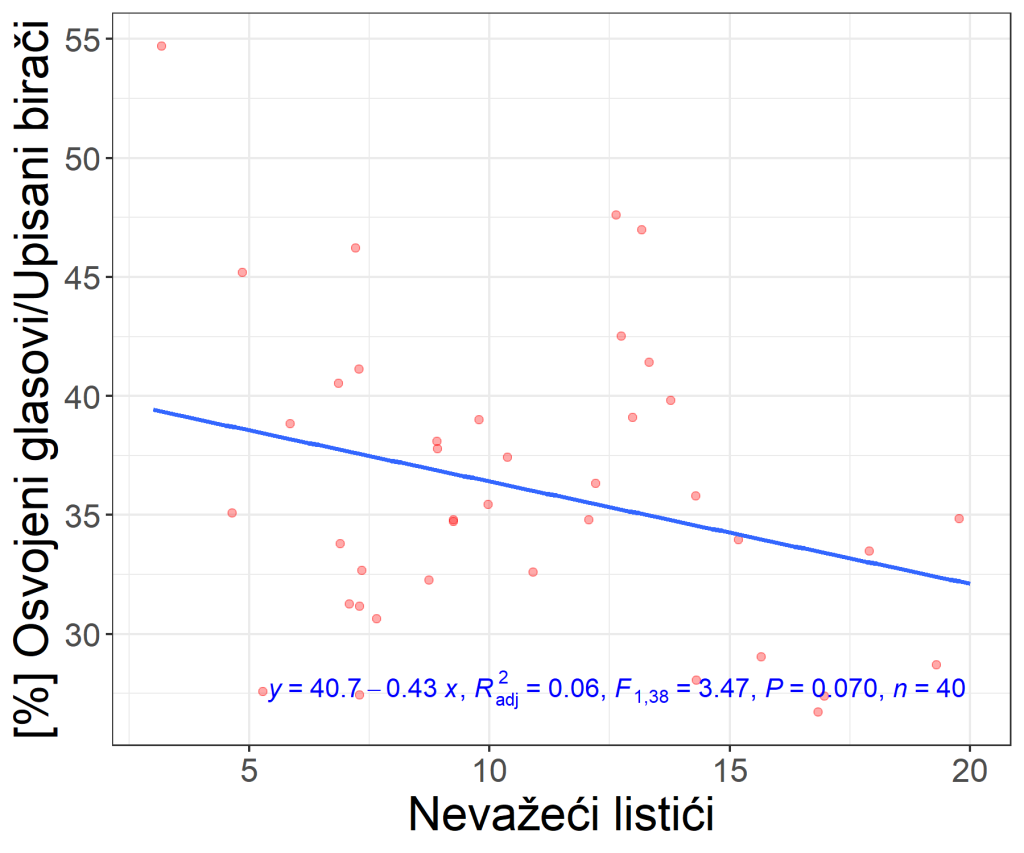
The regression results complicate this initial picture in an analytically interesting way. In Model 1, the coefficient on invalid ballots is −0.430, but it is not statistically significant, and the overall fit is weak (R² = 0.060). In Model 2, once turnout is added, turnout becomes positive and statistically significant (0.818), while the invalid-ballot coefficient weakens slightly to −0.287 and remains insignificant. In Model 3, after adding %Glasali van, the outside-voting coefficient becomes 1.758, positive but not statistically significant at conventional levels, while turnout remains positive and only weakly significant (0.642), and the invalid-ballot coefficient shrinks further to −0.130. The model fit rises to R² = 0.292, but the central explanatory burden appears to fall more on turnout than on invalid ballots or outside voting.
Table 3. Regression analysis
| Model 1 | Model 2 | Model 3 | |
| (Intercept) | 55.685*** | -4.580 | -0.714 |
| (3.165) | (21.832) | (21.234) | |
| Invalid | -0.430 | -0.287 | -0.130 |
| (0.276) | (0.259) | (0.265) | |
| %Turnout | 0.818** | 0.642* | |
| (0.294) | (0.299) | ||
| %Voting outside | 1.758 | ||
| (0.941) | |||
| Num.Obs. | 40 | 40 | 40 |
| R2 | 0.060 | 0.223 | 0.292 |
| R2 Adj. | 0.035 | 0.181 | 0.233 |
| p < 0.05, ** p < 0.01, *** p < 0.001 | |||
This is important because it distinguishes Kula from both Aranđelovac and Bajina Bašta. In Aranđelovac and Bajina Bašta, outside voting emerged more clearly and robustly as a suspicious channel in the regression models. In Kula, outside voting points in the same general direction, but its effect is statistically weaker and does not dominate the model in the same decisive way. The matrix helps explain why. Outside voting is positively correlated with turnout (r = 0.36) and negatively correlated with invalid ballots (r = −0.36). That means some of the apparent outside-voting effect may be overlapping with a broader turnout-related structure rather than constituting a completely independent channel. Once turnout is explicitly controlled, outside voting still points in a suspicious direction, but its independent effect becomes less certain.
Substantively, this means that the hypothesis cannot be dismissed, but neither can it be stated as strongly as in Bajina Bašta. The evidence suggests that voting outside the polling station may have benefited the ruling side, but the mechanism does not appear as statistically clean or isolated. One plausible reading is that outside voting was part of a wider environment of local organizational advantage rather than a fully independent manipulation channel.
5.3 Limitations and caution
This is a good example of why forensic interpretation should resist overstatement. The correlation pattern is suggestive, but the regression evidence is weaker than in the previous municipalities. With only 40 polling stations, omitted variables remain possible, and the positive coefficient on outside voting, although large, is not conventionally significant in the final model. That means the correct conclusion is cautious: this channel is suspicious, but not in a way that allows especially strong standalone claims.
5.4 Conclusion
The Kula results provide some support for the hypothesis that voting outside the polling station benefited the ruling candidate, but the evidence is more mixed than in Aranđelovac or Bajina Bašta. The core correlation pattern, r = 0.44 with %SNS and r = −0.44 with %Glas, points in a suspicious direction, but the regression models do not establish as strong an independent effect for this variable as in the other two municipalities.
6. Invalid ballots and vote shares
Did invalid ballots benefit the ruling candidate?
6.1 Intuitive logic
Invalid ballots matter in election forensics because they can mark the space where administrative handling, voter confusion, and potential manipulation overlap. A negative relationship between the winner’s vote share and the number of invalid ballots is commonly treated as suspicious because it suggests that the winner performs best where fewer ballots are declared invalid. In principle, that may reflect cleaner voting, but in a more suspicious reading it may also reflect selective ballot treatment.
6.2 Results and interpretation
In Kula, the invalid-ballot pattern is present, but it is substantially weaker than in Bajina Bašta and also less robust than in Aranđelovac. The correlation between the number of invalid ballots and %SNS is r = −0.25, while the corresponding correlation with %Glas is r = 0.22. These coefficients point in the expected forensic direction, more invalid ballots where the opposition does somewhat better, fewer where the ruling side does somewhat better, but they are only modest in magnitude. This already suggests that invalid ballots are not among the strongest suspicious channels in Kula.
The percentage of invalid ballots does not strengthen the case. Its correlation with %SNS is r = 0.24, while with %Glas it is r = −0.26. These coefficients are small and somewhat unstable in implication, which suggests that neither the raw invalid count nor the invalid percentage offers a strongly coherent standalone signal in this municipality. This is a marked contrast with Bajina Bašta, where the invalid-ballot pattern was one of the clearer warning indicators. In Kula, invalid ballots may still matter, but they do not appear to define the core suspicious structure of the election.
The regression analysis confirms this more muted interpretation. In Model 1, the invalid-ballot coefficient is −0.430, but not statistically significant. In Model 2 it becomes −0.287, still insignificant, and in Model 3 it declines further to −0.130. This is not the pattern one would expect from a strong Mebane-type signal. Not only is the coefficient never statistically significant, but its magnitude steadily weakens as turnout and outside voting are introduced.
That means that, in Kula, invalid ballots do not appear to have an independently strong forensic role. If they are part of a suspicious structure at all, they are a secondary component, overshadowed by turnout and, to a lesser extent, outside voting. The matrix supports this reading: invalid ballots are negatively related to turnout (r = −0.20) and more clearly negatively related to outside voting (r = −0.36), but those relationships are not strong enough to make invalid ballots central carriers of the broader pattern.
6.3 Limitations and caution
This is precisely the kind of case in which one should not force a stronger interpretation than the data support. The coefficients point somewhat in the suspicious direction, but they are weak and statistically unstable. According to Mebane’s expectation a negative and significant coefficient on invalid ballots would support the hypothesis of manipulation. In Kula, that condition is not met.
6.4 Conclusion
No, the Kula results do not provide strong support for the hypothesis that invalid ballots systematically benefited the ruling candidate. Although the correlation between invalid ballots and %SNS is negative (r = −0.25) and the regression coefficients are also negative, none of these effects is statistically strong enough to sustain a confident forensic conclusion. In Kula, invalid ballots are not one of the central suspicious indicators.
7. Turnout-based forensic regression in the Russian-school tradition
Does the turnout structure suggest that the ruling list benefited disproportionately from higher participation?
7.1 Intuitive logic
One of the better-known tools associated with the Russian school of election forensics examines the relationship between turnout and a candidate’s or list’s vote share measured not as a percentage of valid votes, but as a percentage of registered voters at each polling station. Formally, the model can be written as
$$\frac{V}{E} = \beta T + \alpha,$$
where \(T\) denotes turnout, \(V\) the number of votes won by the candidate or list, and \(E\) the number of registered voters at the polling station. The logic of the tool is straightforward. Under free and fair electoral conditions, one would expect the intercept \(\alpha\) to be approximately equal to the actor’s baseline support, while the slope coefficient \(\beta\) should remain close to zero. That would mean that higher turnout does not systematically translate into disproportionate gains for one political actor.
If, however, turnout is artificially inflated in ways that benefit one list, the coefficient \(\beta\) may become clearly positive, may approach 1, or in stronger anomaly cases may even exceed 1. A slope above 1 is especially suspicious, because it implies that each additional 100 voters turning out are associated with more than 100 additional votes for the favored list. Under ordinary electoral arithmetic, that is not plausible. At the same time, the principal opponent may show a flat or negative slope, indicating that additional turnout does not benefit the opposition proportionately and may even coincide with its relative decline.
7.2 Results and interpretation
In Kula, the graph yields a very clear and forensically important result. For the ruling list Aleksandar Vučić – Kula, naša porodica!, the estimated regression is
$$\frac{V}{E} = -44.4 + 1.12x,$$
with adjusted \(R^2 = 0.43, F_{1,38} = 30.3, P < .001, n = 40\).
For the opposition list Glas mladih opštine Kula, the estimated regression is
$$\frac{V}{E} = 41.8 – 0.116x,$$
with adjusted \(R^2 < 0.01, F_{1,38} = 0.300, P = .587, n = 40\).
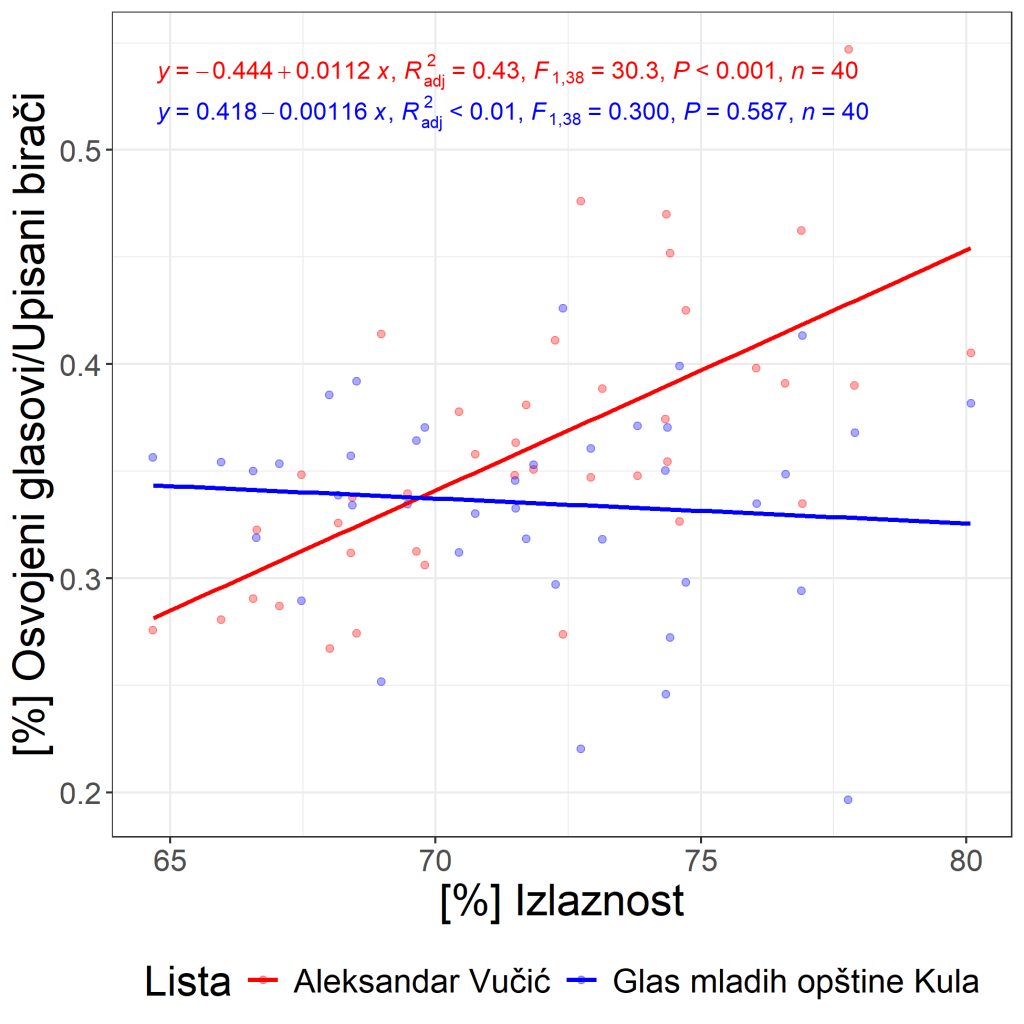
The result for the ruling list is highly suspicious in the precise sense intended by this forensic tool. The estimated slope \(\beta = 1.12\) is not only positive and highly statistically significant, but also greater than 1. Interpreted directly, this means that an increase of 100 additional voters in turnout is associated with roughly 112 additional votes for the ruling list, measured relative to the number of registered voters. Such a pattern is very difficult to reconcile with the logic of ordinary competitive elections. A slope above 1 suggests that turnout growth is being converted into ruling-party gains at a rate exceeding the number of additional participants themselves. This is exactly the type of anomaly that has made this approach one of the more striking tools in election forensics.
The opposition result points in the opposite direction, but much more weakly. The estimated slope for Glas mladih opštine Kula is negative, \(\beta = -0.116\), which means that as turnout rises, the opposition’s share among registered voters tends to decline slightly. This direction is consistent with the broader forensic concern that higher turnout was more useful to the ruling side than to its main opponent. However, this coefficient is not statistically significant. That means the graph does not justify a strong standalone claim that turnout systematically depressed opposition support in Kula. What it does justify, very clearly, is the conclusion that the ruling side converted turnout growth into an implausibly steep increase in support.
This result is particularly important because it sharpens the interpretation of the earlier Kula findings. In the ordinary turnout section, the correlations already suggested that higher turnout was more favorable to the ruling side than to the opposition. The broader graphical analysis across several election cycles also pointed in a suspicious direction. The present Russian-school regression now strengthens that conclusion substantially. It shows not merely that turnout and ruling support moved together, but that the estimated conversion of turnout into ruling-party votes is again greater than 1. That makes this section one of the strongest warning signals in the Kula report.
It also places Kula closer to Aranđelovac than to Bajina Bašta on this particular forensic tool. In Aranđelovac, the estimated ruling slope was 1.19; in Kula, it is 1.12. Both are above 1 and both are highly significant. By contrast, Bajina Bašta produced a positive and significant ruling slope, but it remained below 1. This comparative pattern suggests that turnout-based irregularity appears especially sharp in Aranđelovac and Kula, even though the broader suspicious structure in Bajina Bašta is very strong through other channels.
7.3 Limitations and caution
Even so, this method should not be treated as a self-sufficient proof. A steep positive slope is a strong forensic indicator, but it does not by itself reveal the precise mechanism. In principle, one could imagine highly uneven partisan mobilization, local clustering of particularly loyal ruling-party voters, or other organizational asymmetries that would produce a strong positive relationship. What makes the Kula result suspicious is not merely that the slope is positive, but that it is greater than 1, highly statistically significant, and broadly consistent with several other warning signs in the report.
It is also important to keep the asymmetry of the evidence in view. The ruling-list slope is the central finding. The opposition slope is negative, but not statistically significant. Therefore, the strongest conclusion from this graph is not that both sides exhibit equally strong suspicious reactions to turnout, but that the ruling side shows an anomalously strong turnout-conversion pattern. That is the key forensic implication.
Finally, this tool works with vote share measured relative to registered voters, not relative to valid votes cast. That is precisely why the coefficient \(\beta\) is so revealing. But it also means the interpretation must be explained carefully, so that readers understand why a slope above 1 is not merely “large,” but mathematically and politically problematic.
7.4 Conclusion
Yes, this turnout-based forensic regression strongly supports the hypothesis that the ruling list in Kula benefited disproportionately from higher turnout. The key reason is the estimated slope of \(\beta = 1.12\) for the ruling list, which is highly statistically significant and greater than 1. This is a highly anomalous result and one of the strongest warning signs in the Kula analysis. By contrast, the opposition slope is negative but not statistically significant, so the main forensic weight of this section rests on the implausibly steep and significant turnout effect for the ruling side.
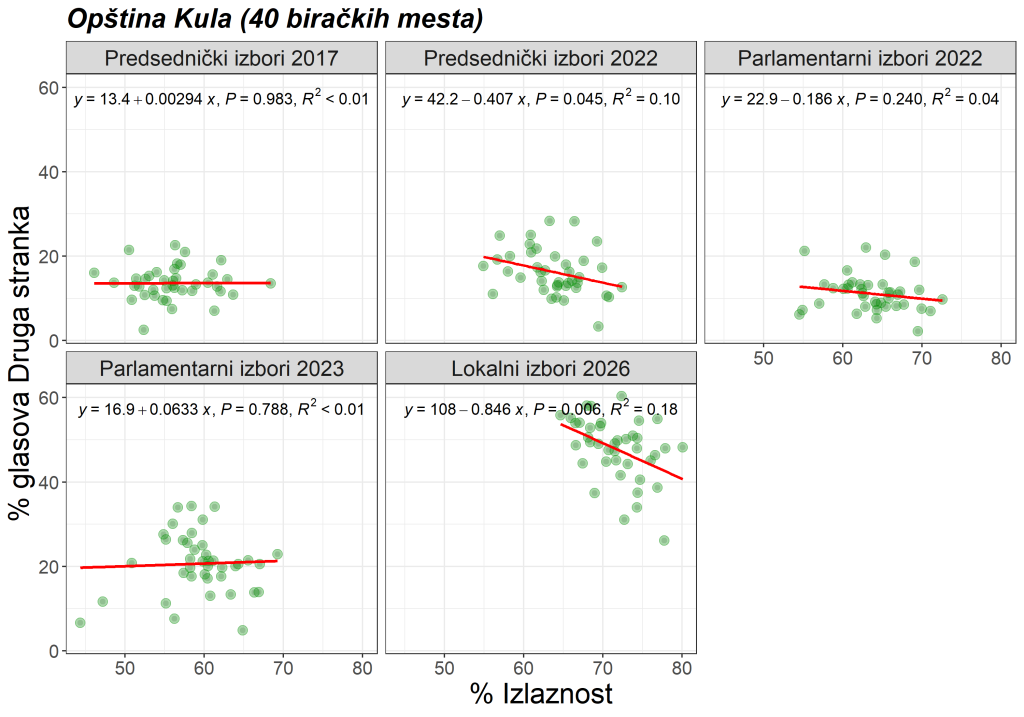
8. Graphical analysis of vote shares by turnout
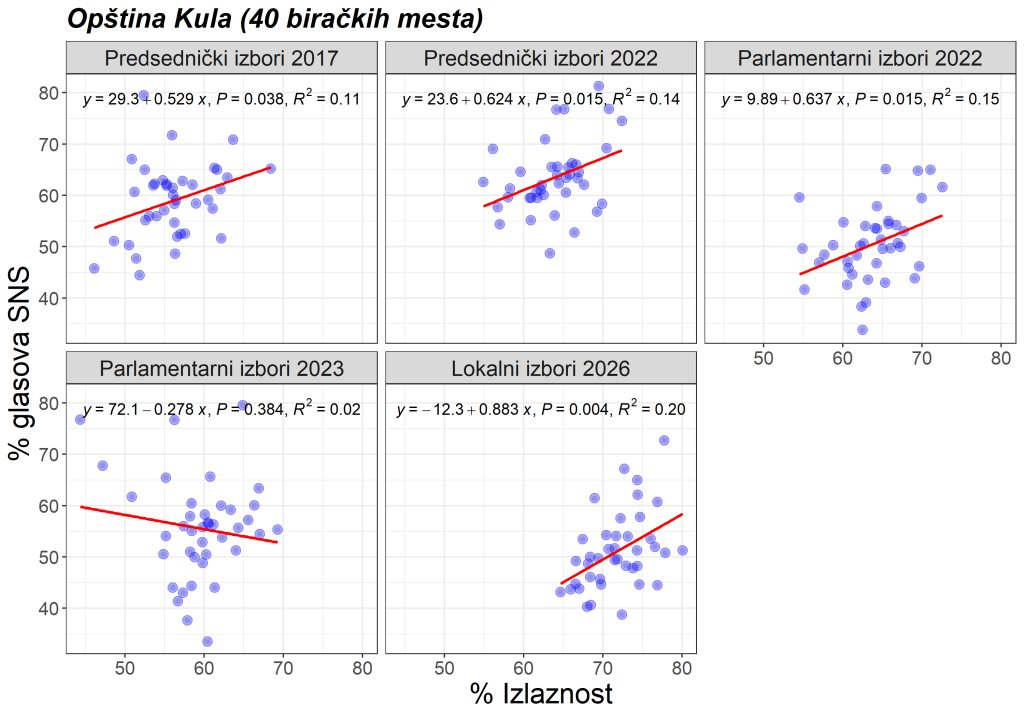
We treat this section as one of the most important parts of the Kula analysis. Only the 2023 parliamentary election shows a negative slope for the winner’s turnout relationship, and even there the relationship is not statistically significant. In all other cases, the relationship between the winner’s vote share and turnout is statistically significant. This is the kind of outcome expected if there had been electoral manipulation.
The opposition plots tell a similarly important story. The regression slope is predominantly negative, which means that as turnout rises, the opposition’s share of valid votes falls. However, that relationship is statistically significant only at the 2022 presidential election among the earlier elections. By contrast, at the 2026 local election the relationship between opposition vote share and turnout is described as strongly negative and highly statistically significant, which could be interpreted as a possible sign of manipulation at these local elections.
This makes the graphical turnout analysis in Kula much more suspicious than the simple turnout correlations alone might suggest. It indicates that while turnout may not dominate every model directly, its broader historical structure across election cycles points toward a recurring asymmetry that particularly crystallizes in the latest local election.
9. Klimek curves
In Kula there were 40 polling stations, and because of the small number of observations, especially at high turnout, it is difficult to infer possible manipulation from the Klimek curve alone. This should remain the core message of this section.
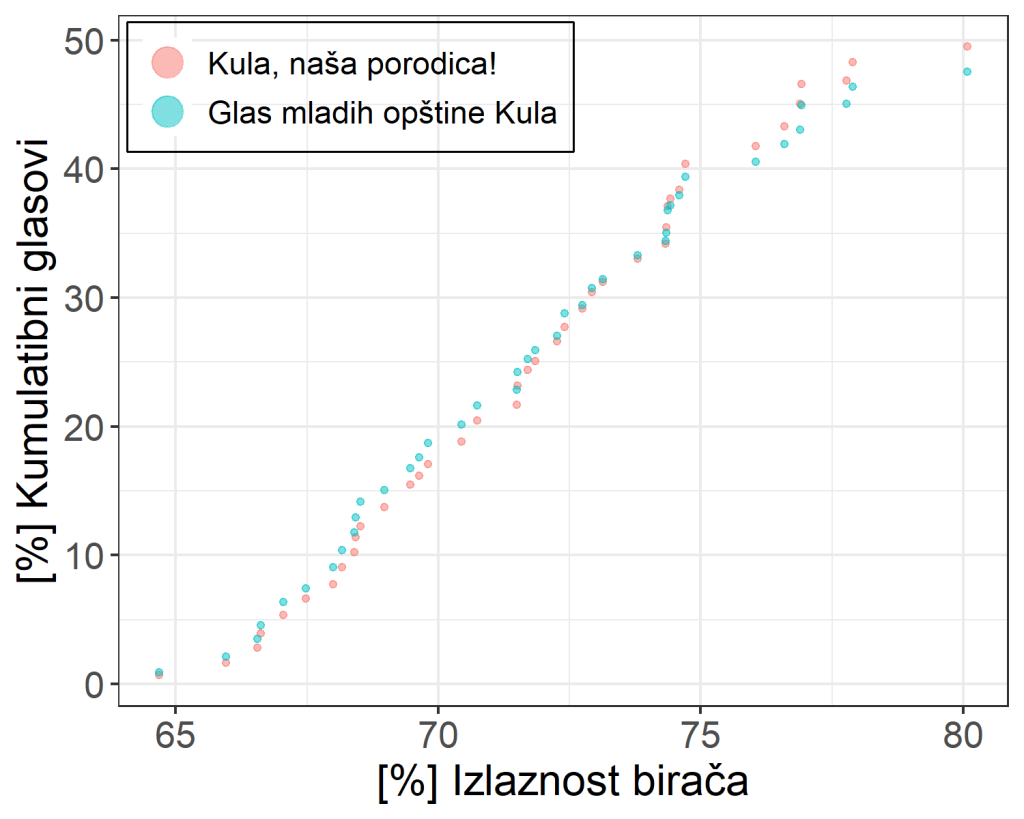
As in the previous municipal sections, the right interpretation is restrained. The Klimek curves may be worth visually inspecting, and they may contribute marginally to the cumulative impression. But in Kula, as in the other municipalities, they are too fragile under small-sample conditions to justify strong standalone claims.
10. Election fingerprints
The attention should be given to both the 2D histogram and the marginal distributions, with special attention to the smudge elongated toward high winner percentages and to changes in shape across the last five elections in Kula. In a fair and free election, one expects a relatively compact central concentration, not a strongly stretched cloud toward the upper-right or a marginal distribution distorted in ways suggestive of layered local electoral environments.
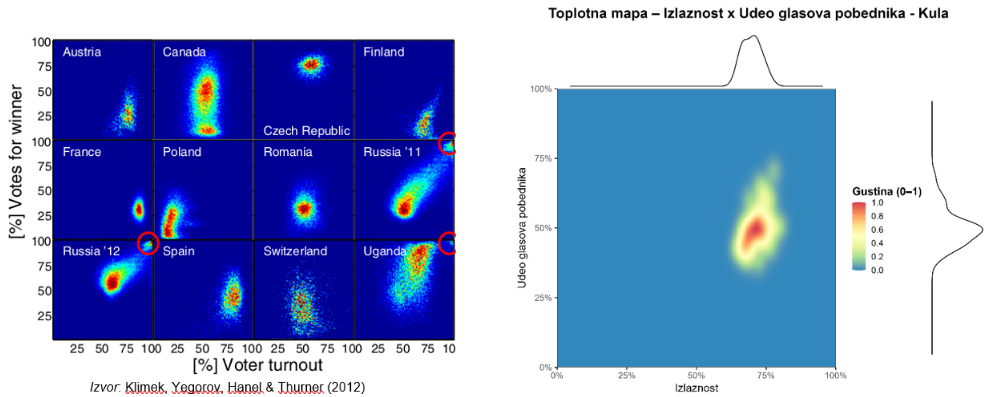
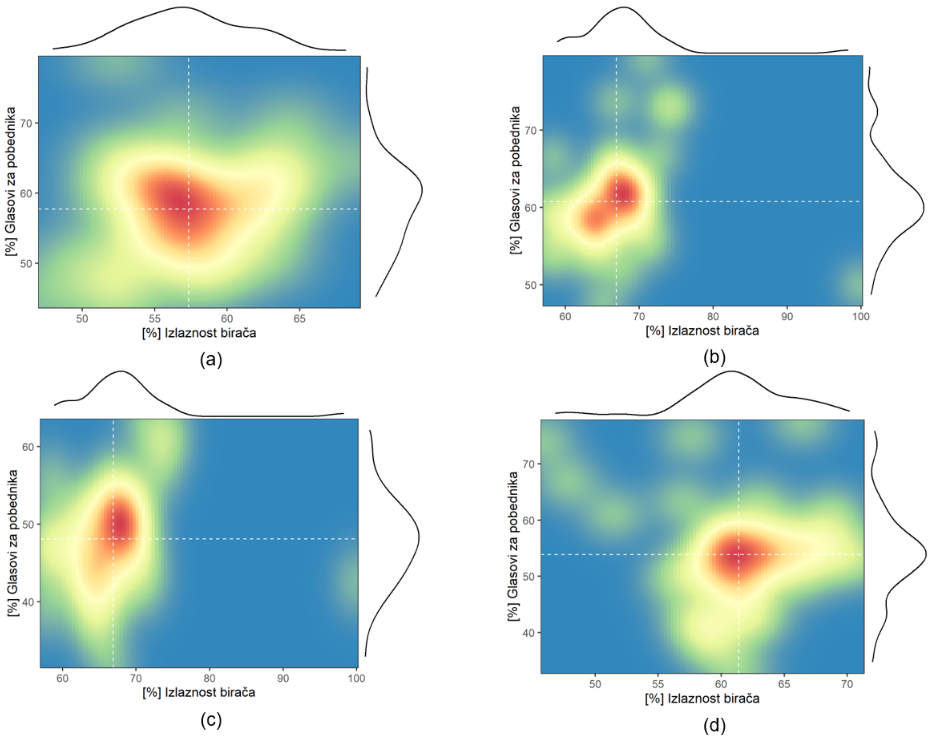
The local-election fingerprint deserves scrutiny, especially for the elongated smudge toward high winner percentages. It is best treated as a supportive visual indicator rather than a decisive proof.
11. Finite-mixture model
The finite-mixture model in Kula yields a distinctly suspicious, though less extreme, picture than in Bajina Bašta. The polling stations fall into three classes: 10 “no fraud” stations, 24 “incremental fraud” stations, and 6 “extreme fraud” stations. The mean turnout and mean winner share rise across these classes: the no-fraud group has mean turnout 68.1% and winner share 42.3%; the incremental-fraud class has 72.8% turnout and 50.1% winner share; and the extreme-fraud class has 74.2% turnout and 63.3% winner share. The total model-based fraud share is estimated at 0.7511, meaning about 75.11% of the winner’s votes are associated with the suspicious classes under the model.
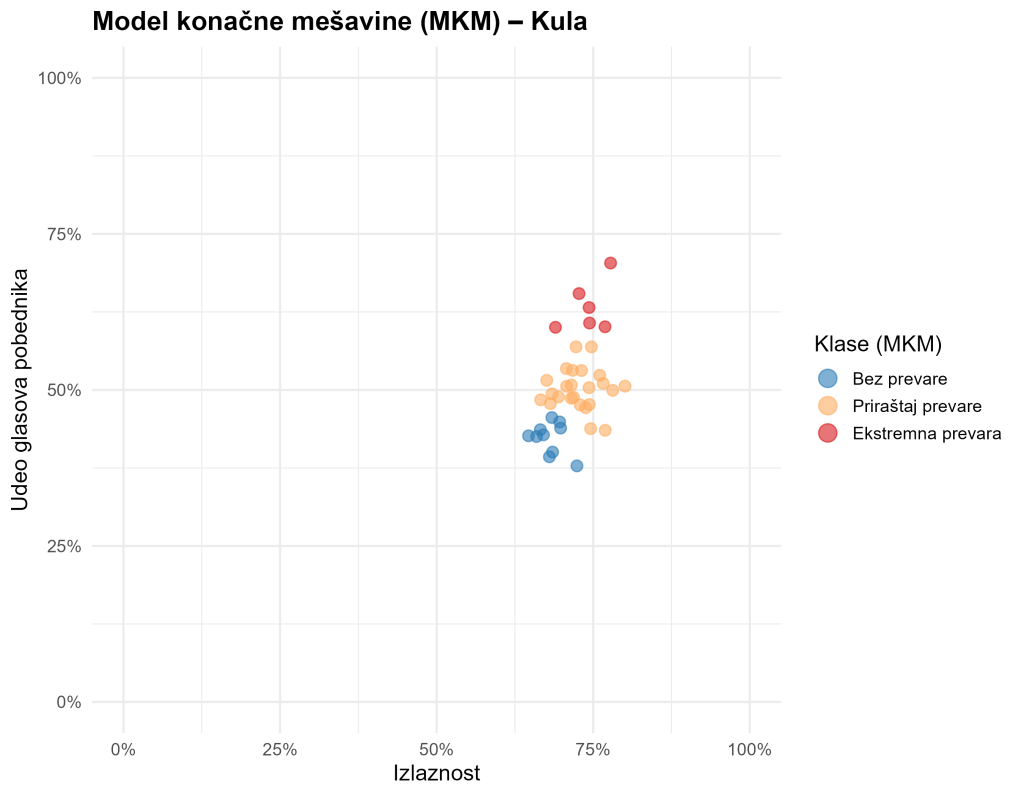
The fitted-parameters are consistent with the same structure. The largest cluster is the incremental-fraud class (Pi = 0.541), followed by the no-fraud class (Pi = 0.290) and the extreme-fraud class (Pi = 0.169). Mean turnout and mean winner share increase from the regular class toward the extreme class, exactly as one would expect under Mebane’s logic. In interpretive terms, incremental fraud corresponds to more moderate but systematic forms of electoral distortion, while extreme fraud corresponds to more concentrated winner inflation under very favorable turnout–winner conditions. Kula therefore does not look as extreme as Bajina Bašta, but it still appears highly suspicious in the mixture-model framework.
Again, methodological caution remains essential. The fraud-share estimate should not be misread as a literal legal count of fraudulent ballots. It is a model-based summary of how much of the winner’s vote is associated with suspicious latent classes under the assumptions of the finite-mixture model. Still, a 75.11% fraud-share estimate is far too high to be dismissed casually. It makes the finite-mixture model one of the strongest warning indicators in the Kula case.
12. Executive Summary
Data and preparation
This report analyzes polling-station-level data for the 2026 local election in Kula using a multi-method election-forensics framework. The analysis combines a correlation matrix, regression models, turnout graphics, Klimek curves, election fingerprints, and a finite-mixture model. Because Kula has 40 polling stations, every method requires interpretive caution, especially the small-sample graphical and latent-class tools. Still, the cumulative structure of the evidence remains analytically important.
Turnout and vote shares
Higher turnout appears to have been more favorable to the ruling list than to the main opposition. The key correlations are r = 0.44 for turnout and %SNS, and r = −0.43 for turnout and %Glas. The ruling and opposition lists themselves are almost perfectly inverse (r = −1.00), confirming an extremely polarized local race.
Voting outside the polling station and vote shares
Outside voting points in a suspicious direction, though less conclusively than in Aranđelovac or Bajina Bašta. The correlations are 0.44 with the ruling list and −0.44 with the main opposition. In the regression models, the coefficient is positive (1.758) but not strongly significant in the final specification, suggesting a suspicious but not fully isolated channel.
Invalid ballots and vote shares
Invalid ballots are not among the strongest forensic indicators in Kula. Their correlation with the ruling list is negative (r = −0.25), and the regression coefficients are also negative, but none is statistically strong enough to sustain a robust Mebane-style conclusion. Unlike in Bajina Bašta, invalid ballots do not appear to be a central suspicious mechanism here.
Turnout-based forensic regression in the Russian-school tradition
In the additional check based on the Russian school of election forensics, Kula shows one of the strongest turnout-related warning signs in the entire analysis. The estimated slope coefficient for the ruling list is \(\beta = 1.12\) and is highly statistically significant, meaning that higher turnout was associated with an implausibly large increase in support for the ruling side relative to the number of registered voters. Such a result is difficult to reconcile with the normal logic of free and fair elections, because it suggests that the ruling list was gaining more votes from additional turnout than would be mathematically plausible under regular conditions. The opposition list showed a negative slope, but without statistical significance, so the central conclusion of this tool remains clear: in Kula, turnout functioned as a strongly asymmetric channel that disproportionately benefited the ruling side.
Graphical analysis by turnout
The turnout graphics are more suspicious than the simple turnout correlations alone. According to the attached notes, the winner’s turnout relationship is statistically significant in all but one of the five elections shown, and the 2026 local election shows a strongly negative and highly significant turnout relationship for the opposition. This is one of the more important warning signs in the Kula case.
Klimek curves
The Klimek curves are too fragile to support strong standalone claims because the number of polling stations is small. They may contribute marginally to the overall picture, but they should not carry decisive weight.
Election fingerprints
The election-fingerprint evidence deserves attention, especially the elongated smudge toward high winner percentages and the comparative changes across earlier elections. On its own, the method is not decisive, but it fits the broader suspicious structure rather than contradicting it.
Finite-mixture model
The finite-mixture model is strongly suspicious. Most polling stations fall into the incremental-fraud class, with an additional extreme-fraud group, and the total model-based fraud-share estimate is about 75.11%. This is methodologically qualified but analytically serious.
Overall assessment
Taken together, the Kula findings provide serious grounds for suspicion that the local election result was not generated under fully fair and neutral competitive conditions. The strongest suspicious elements are the turnout-related graphical pattern and the finite-mixture output, with outside voting also pointing in the same direction. Invalid ballots, by contrast, appear less central than in Bajina Bašta. Overall, the evidence suggests a meaningfully distorted electoral environment, though not every forensic indicator is equally strong.
13. Methodological appendix
This report uses seven complementary election-forensics approaches. Correlation analysis serves as an initial screening device for systematic polling-station-level relationships. Regression analysis tests whether those relationships remain when multiple explanatory variables are considered jointly. Turnout graphics examine whether higher participation disproportionately benefits the ruling side and harms the opposition. Klimek curves assess whether cumulative vote growth resembles a democratic plateau or a more suspicious acceleration pattern. Election fingerprints inspect the joint distribution of turnout and winner share, together with the shape of their marginal distributions. Finally, the finite-mixture model classifies polling stations into latent regular and suspicious types and estimates the winner’s vote share associated with each class. None of these methods is conclusive on its own. But together they offer a structured framework for evaluating electoral integrity in a small local setting.
Director of Wellington based My Statistical Consultant Ltd company. Retired Associate Professor in Statistics.
Has a PhD in Statistics and over 45 years experience as a university professor, consultant, international researcher and government advisor.