1. Combined analytical frame and result summary
This section shifts the unit of analysis from the individual municipality to the pooled dataset covering Aranđelovac, Bajina Bašta, and Kula together. The purpose of this combined analysis is not to erase local differences. On the contrary, it is to examine whether the suspicious patterns observed separately in the three municipalities become clearer, weaker, or qualitatively different once all polling stations are analyzed together. Pooling the data creates a larger sample and therefore a somewhat more stable environment for several election-forensics tools, especially those that become fragile in small municipal datasets. At the same time, the combined analysis makes it possible to interpret each municipality in the light of a wider local-election pattern rather than as an isolated case.
The pooled dataset contains 133 polling stations in total. That number is still modest by the standards of national-level election forensics, but it is a substantial improvement over the separate municipal analyses. It is large enough to make the aggregate correlation matrix, the regression models, the fingerprint structure, and the finite-mixture model more informative than they were at the individual-municipality level. The central question, therefore, is whether the combined structure of the data supports the interpretation that these local elections, taken together, exhibit meaningful signs of political distortion and possible manipulation.
Table 1. Combined official result summary for the three municipalities
| Electoral list | % votes | Mandates |
| Aranđelovac | ||
| Aleksandar Vučić – Aranđelovac, naša porodica! | 50.12 | 21 |
| Ruska stranka – Za bolji Aranđelovac! | 1.08 | 0 |
| Studenti za Aranđelovac – Mladost pobeđuje | 46.08 | 20 |
| Koalicija 381 – Ujedinjeni podržavamo mlade | 0.39 | 0 |
| Srpski liberali za zeleni Aranđelovac | 0.60 | 0 |
| Bajina Bašta | ||
| Aleksandar Vučić – Bajina Bašta, naša porodica! | 52.37 | 25 |
| Ujedinjeni za Bajinu Baštu | 40.33 | 20 |
| Zdrava Srbija – Milan Stamatović | 1.79 | 0 |
| Socijaldemokratska partija Srbije – Marija Milosavljević | 2.25 | 0 |
| Izađi – Izbori se za Bajinu Baštu – Srpski liberali | 0.43 | 0 |
| Nestranački pokret za Bajinu Baštu | 0.62 | 0 |
| Kula | ||
| Aleksandar Vučić – Kula, naša porodica! | 49.49 | 19 |
| Mladi za Kulu | 0.60 | 0 |
| Glas mladih opštine Kula | 47.53 | 18 |
| Rusinska lista | 0.27 | 0 |
| Srpski liberali za zelenu Kulu | 0.31 | 0 |
| Winner lists | 65 | |
| Opposition lists | 58 |
2. Analytical framework
This report uses the same multi-method election-forensics framework as in the three separate municipal sections, but applied now to the pooled sample. The analysis combines a correlation matrix, regression models, graphical analysis of turnout and vote share across several election cycles, Klimek-style cumulative curves, election fingerprints, and Mebane’s finite-mixture model. The purpose is not to treat any single indicator as a judicial proof of fraud. The purpose is to examine whether the aggregate structure of these three local elections is more consistent with ordinary democratic competition or with a politically unequal and potentially manipulated electoral environment.
Pooling the municipalities has one major methodological advantage. It increases the number of observations and therefore reduces some of the instability that affects small-sample local election forensics. But it also introduces a challenge: not every suspicious pattern has to operate identically in every municipality. The combined analysis should therefore be interpreted in two directions at once. First, it tells us whether there is a common pattern across the three municipalities. Second, it helps us reassess the individual municipal findings in light of that wider pattern. A signal that appears moderate in one municipality may become more meaningful if it aligns with the aggregate result. Conversely, a signal that weakens in the pooled data may indicate that it was more locally specific than general.
3. Turnout and vote shares
Did higher turnout benefit the ruling party or the opposition?
3.1 Intuitive logic
In the pooled setting, the turnout question becomes especially important. If turnout systematically benefits the ruling side across several different municipalities, that is harder to dismiss as a purely local accident. In election forensics, a repeated positive turnout–winner relationship and a repeated negative turnout–opposition relationship are treated as warning signs because they suggest that participation is not functioning as a politically neutral process. Instead, turnout begins to look like a selective mobilization mechanism in which one side disproportionately gains from rising participation.
3.2 Results and interpretation
The combined correlation matrix suggests that turnout was indeed more beneficial to the ruling side than to the opposition, though not overwhelmingly so. We shaded positive significant correlation coefficients in green, and negative significant ones in red. The ruling party’s vote share (%SNS) has a positive correlation with turnout of r = 0.24, while the opposition share (%Opozicija) has a negative correlation with turnout of r = −0.26. These are not extremely large coefficients, but they are clearly directional and, in the context of pooled local-election data, substantively meaningful. They indicate that as turnout rose across polling stations in the combined sample, the ruling side tended to improve its percentage position while the opposition tended to lose ground.
Table 2. Combined correlation matrix
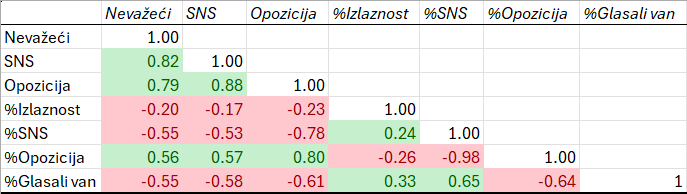
The structural relationship between the two main camps is extremely strong. The correlation between %SNS and %Opozicija is r = −0.98, which is near perfect. This confirms that once the three municipalities are harmonized into common ruling-versus-opposition variables, the local elections together form an overwhelmingly bipolar field. Where the ruling side gains, the opposition loses, and vice versa. That does not in itself prove manipulation. But it means that the interpretation of turnout becomes politically sharper: if rising turnout helps one side in such a tightly bipolar field, the relative cost is borne almost entirely by the other side.
The combined matrix also shows that turnout is not acting completely independently of the broader electoral environment. It is negatively correlated with the number of invalid ballots (r = −0.20) and positively correlated with the percentage voting outside the polling station (r = 0.33). This suggests that higher-turnout polling stations in the pooled sample were also somewhat more likely to be polling stations with fewer invalid ballots and more outside voting. In other words, turnout is linked to a broader cluster of characteristics that may point toward a more organized and less transparent local voting environment. The combined result is therefore stronger than a simple statement that “turnout helped the ruling side.” It suggests that higher turnout is embedded in a broader asymmetrical electoral structure.
It is also useful to read this result against the individual municipal cases. In Aranđelovac, turnout was one of the strongest suspicious indicators. In Bajina Bašta, turnout looked comparatively normal. In Kula, turnout looked more suspicious in the graphical analysis than in the simpler correlations. The pooled coefficient of 0.24 for %SNS and −0.26 for %Opozicija suggests that, once these three municipalities are combined, the turnout asymmetry survives as a common pattern, though one driven more strongly by Aranđelovac and Kula than by Bajina Bašta. That is analytically important because it tells us that the suspicious turnout structure is not a one-off anomaly confined to a single municipality.
3.3 Limitations and caution
Even in the pooled sample, turnout correlations remain inferentially limited. They do not identify the mechanism and cannot separate legal partisan mobilization from less legitimate organizational influence. Municipal aggregation also means that some local political variation is compressed into common variables. Therefore, the correct conclusion is not that turnout manipulation has been proven. The correct conclusion is that turnout behaves asymmetrically enough across the pooled sample to justify forensic concern, especially because the same direction appears again in the later graphical analysis.
3.4 Conclusion
Yes, the combined results support the conclusion that higher turnout was more favorable to the ruling side than to the opposition. The key coefficients are r = 0.24 for turnout and %SNS, and r = −0.26 for turnout and %Opozicija, against a strongly bipolar ruling–opposition field (r = −0.98). In the pooled forensic setting, that is a meaningful warning sign.
4. Voting outside the polling station and vote shares
Did voting outside the polling station benefit the ruling candidate?
4.1 Intuitive logic
Voting outside the polling station is one of the most sensitive administrative channels in election forensics because it combines legitimate access facilitation with reduced transparency. If, across several municipalities, this form of voting is repeatedly associated with stronger performance by the ruling side and weaker performance by the opposition, that pattern becomes difficult to treat as accidental. It suggests that this administrative channel may not be politically neutral.
4.2 Results and interpretation
The combined correlation matrix provides a strong initial answer. The percentage voting outside the polling station (%Glasali van) is positively correlated with %SNS at r = 0.65 and negatively correlated with %Opozicija at r = −0.64. These are large coefficients, and they are among the strongest in the pooled matrix. In practical terms, polling stations with more outside voting tended to be polling stations where the ruling side performed substantially better and the opposition substantially worse. This is exactly the pattern one would expect if outside voting were an electorally asymmetric channel.
The regression analysis reinforces this reading and does so more cleanly than in most of the separate municipal cases. In Model 1, the coefficient on invalid ballots is −0.912, highly significant, with R² = 0.308. In Model 2, after turnout is added, the invalid-ballot coefficient remains very similar at −0.868, while turnout itself is 0.246 and not statistically significant. This is already important because it shows that turnout contributes relatively little once the invalid-ballot structure is taken into account. But the major shift comes in Model 3. Once %Glasali van is added, it enters with a positive and highly significant coefficient of 1.190, while the invalid-ballot coefficient drops from −0.868 to −0.471 and the model fit rises sharply to R² = 0.474.
Table 3. Combined regression analysis
| Model 1 | Model 2 | Model 3 | |
| (Intercept) | 64.973*** | 46.577*** | 50.997*** |
| (1.391) | (9.978) | (8.874) | |
| Invalid | -0.912*** | -0.868*** | -0.471*** |
| (0.120) | (0.121) | (0.126) | |
| %Turnout | 0.246 | 0.050 | |
| (0.132) | (0.122) | ||
| %Voting Outside | 1.190*** | ||
| (0.197) | |||
| Num.Obs. | 133 | 133 | 133 |
| R2 | 0.308 | 0.326 | 0.474 |
| R2 Adj. | 0.302 | 0.315 | 0.462 |
| p < 0.05, ** p < 0.01, *** p < 0.001 | |||
This is a very important structural result. It indicates that outside voting explains a substantial part of the suspicious local pattern that simpler models had previously attributed to invalid ballots alone. The combined correlation matrix supports the same interpretation. Outside voting is negatively correlated with invalid ballots (r = −0.55) and also negatively correlated with the raw ruling and opposition vote counts (r = −0.58 with SNS and r = −0.61 with Opozicija), while being positively associated with the ruling percentage. That pattern is consistent with a setting in which outside voting is not simply more frequent where more people vote overall, but where the distribution of votes becomes more favorable to the ruling side under those conditions. In short, outside voting appears to capture an important dimension of ruling-party advantage across the pooled sample.
It is also useful to interpret this against the separate opština findings. In Aranđelovac, outside voting was already one of the strongest suspicious channels. In Bajina Bašta, it also emerged clearly and strongly. In Kula, the evidence was more mixed, though still suggestive. The pooled regression result shows that once all three municipalities are analyzed together, outside voting becomes one of the clearest common suspicious indicators across the combined local-election dataset. That is analytically significant because it suggests that the effect is not merely a local idiosyncrasy.
4.3 Limitations and caution
The result is strong, but the usual caution still applies. Regression coefficients do not identify the precise mechanism. Outside voting may capture organizational asymmetry, demographic structure, dependent-voter mobilization, weak monitoring of mobile ballot-box procedures, or more direct forms of manipulation. The evidence therefore does not authorize a simplistic claim that abuse is proven. It does, however, justify a serious forensic conclusion that outside voting was one of the most politically asymmetric channels in the pooled sample.
4.4 Conclusion
Yes, the combined results strongly support the hypothesis that voting outside the polling station benefited the ruling candidate. The key findings are the 0.65 correlation between %Glasali van and %SNS, the −0.64 correlation with %Opozicija, and the 1.190* coefficient in the full regression model. Taken together, they make outside voting one of the clearest suspicious channels across the three municipalities combined.
5. Invalid ballots and vote shares
Did invalid ballots benefit the ruling candidate?
5.1 Intuitive logic
Invalid ballots are forensically important because they stand at the intersection of voter intent, administrative judgment, and the possibility of selective ballot handling. If fewer invalid ballots systematically coincide with stronger ruling-party performance and weaker opposition performance across multiple municipalities, that pattern becomes difficult to treat as incidental. In the Mebane framework, a negative and statistically significant coefficient on invalid ballots is one of the classic warning signs.
5.2 Results and interpretation
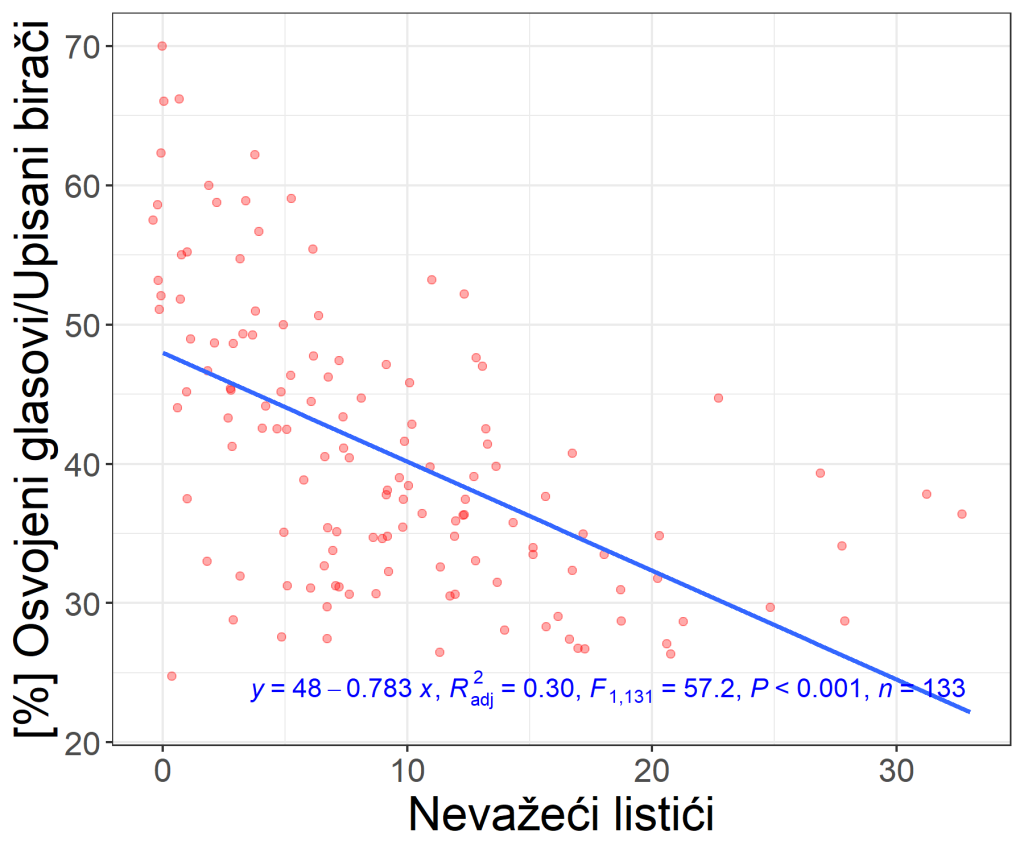
The combined correlation matrix shows a strong and coherent pattern. The number of invalid ballots is negatively correlated with %SNS at r = −0.55, and positively correlated with %Opozicija at r = 0.56. These are substantial coefficients. They suggest that polling stations with more invalid ballots tended to record lower ruling-party percentages and higher opposition percentages, while polling stations with fewer invalid ballots tended to show the reverse. The same general logic is visible in the raw vote totals as well: invalid ballots correlate positively with both SNS (r = 0.82) and Opozicija (r = 0.79) in absolute terms, which is unsurprising because larger polling stations tend to produce more of everything. But once the analysis shifts to percentage terms, the ruling–opposition divergence becomes clear and politically consequential.
The regression analysis strengthens this interpretation considerably. In Model 1, the coefficient on invalid ballots is −0.912, highly significant, with R² = 0.308. This means that, in the pooled sample, reducing the number of invalid ballots by one is associated with an increase of roughly 0.91 percentage points in the ruling candidate’s share, measured on the underlying percentage scale used in the model. In Model 2, after turnout is added, the coefficient remains almost unchanged at −0.868, showing that turnout contributes very little to this structure. The effect is therefore robust. Even in Model 3, after outside voting is added, the invalid-ballot coefficient remains −0.471, still highly significant though substantially reduced in magnitude.
This is exactly the kind of pattern that Mebane’s logic asks us to watch for. The coefficient is negative, statistically significant, and strong enough to explain a meaningful share of the variation in the ruling side’s percentage. The reduction in magnitude from −0.868 to −0.471 when outside voting is introduced is also analytically revealing. It suggests that invalid ballots and outside voting are partially overlapping suspicious channels. Part of the initial invalid-ballot effect appears to operate through the same polling-station environments in which outside voting is more prevalent. But the fact that the coefficient remains highly significant even after this control means that invalid ballots retain an independent forensic role in the pooled sample.
This pooled result also helps interpret the municipalities comparatively. In Bajina Bašta, invalid ballots were one of the strongest suspicious indicators. In Aranđelovac, they were suspicious but partly absorbed by outside voting. In Kula, they were relatively weak. Once the data are combined, the pooled result shows that invalid ballots remain a strong and common suspicious signal overall. In that sense, Bajina Bašta and Aranđelovac drive the pooled pattern more strongly than Kula, but Kula is not enough to erase the larger combined structure.
5.3 Limitations and caution
Even so, invalid-ballot analysis remains indirect. The coefficient does not tell us whether ballots were intentionally reclassified, selectively invalidated, or simply patterned by another local factor correlated with ruling-party advantage. The correct interpretation is forensic rather than judicial. Still, the pooled result is strong enough that it cannot be treated as statistical noise or as a merely local curiosity.
5.4 Conclusion
Yes, the combined results strongly support the proposition that invalid ballots were linked to an outcome favorable to the ruling candidate. The key findings are the −0.55 correlation between invalid ballots and %SNS, the 0.56 correlation with %Opozicija, and the large, negative, highly significant regression coefficients (−0.912, −0.868, and −0.471 across the three models). In the pooled sample, invalid ballots are one of the clearest suspicious indicators.
6. Turnout-based forensic regression in the Russian-school tradition
Does the turnout structure suggest that the ruling side benefited disproportionately from higher participation across the three municipalities?
6.1 Intuitive logic
One of the better-known tools associated with the Russian school of election forensics examines the relationship between turnout and a candidate’s or list’s vote share measured not as a percentage of valid votes, but as a percentage of registered voters at each polling station. Formally, the model can be written as
$$\frac{V}{E} = \beta T + \alpha,$$
where \(T\) denotes turnout, \(V\) the number of votes won by the candidate or list, and \(E\) the number of registered voters at the polling station. The logic of the tool is straightforward. Under free and fair electoral conditions, one would expect the intercept \(\alpha\) to be approximately equal to the actor’s baseline support, while the slope coefficient \(\beta\) should remain close to zero. That would mean that higher turnout does not systematically translate into disproportionate gains for one political actor.
If, however, turnout is artificially inflated in ways that benefit one actor, the coefficient \(\beta\) may become clearly positive, may approach 1, or in especially strong anomaly cases may even exceed 1. A slope close to 1 already raises concern, because it implies that each additional 100 voters turning out are associated with almost 100 additional votes for the favored side. A slope above 1 is even more suspicious, since it suggests an implausibly steep conversion of turnout growth into political support. At the same time, the main opponent may show a flat or negative slope, indicating that the same turnout growth does not benefit the opposition proportionately and may even coincide with its relative decline.
6.2 Results and interpretation
In the pooled dataset covering Aranđelovac, Bajina Bašta, and Kula, the graph gives a clear and analytically important result. For the ruling bloc, the estimated regression is
$$\frac{V}{E} = -25.8 + 0.911T,$$
with adjusted \(R^2 = 0.34, F_{1,131} = 68.7, P < .001, n = 133\).
For the opposition bloc, the estimated regression is
$$\frac{V}{E} = 30.1 – 0.0179T,$$
with adjusted \(R^2 < 0.01, F_{1,131} = 0.0237, P = .878, n = 133\).
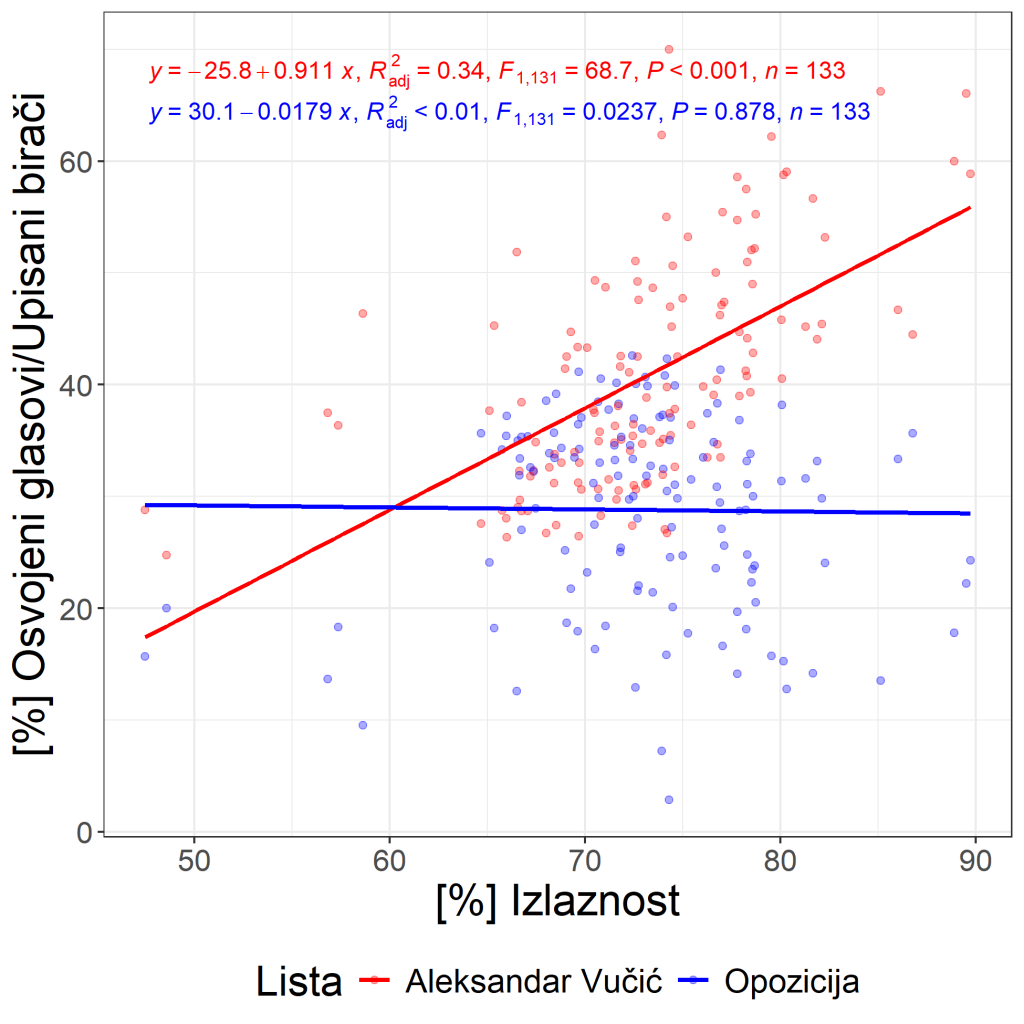
The result for the ruling bloc is highly significant and forensically meaningful. The estimated slope \(\beta = 0.911\) is not greater than 1, so it does not reach the mathematical extremity observed in Aranđelovac and Kula separately. But it is still very close to 1, and it is highly statistically significant. Interpreted directly, this means that an increase of 100 additional voters in turnout is associated with about 91 additional votes for the ruling side, measured relative to the number of registered voters. Under ordinary electoral conditions, that is already a very steep conversion of turnout into support. It suggests that turnout growth was not acting as a neutral participation process, but as a channel from which the ruling bloc derived a strong and systematic advantage.
The opposition result is the opposite in both statistical and substantive terms. The estimated slope is slightly negative, \(\beta = -0.0179\), but it is essentially flat and entirely statistically insignificant. That means that in the pooled data, additional turnout does not appear to have generated any meaningful increase in opposition support when measured against the number of registered voters. In other words, the combined pattern is strongly asymmetric: turnout growth is converted into significant support for the ruling bloc, while the opposition shows no corresponding turnout benefit.
This pooled result is especially valuable because it integrates the three municipalities into a single forensic picture. In Aranđelovac, the ruling slope was 1.19, one of the strongest anomalies in the whole analysis. In Kula, it was 1.12, again above 1 and highly significant. In Bajina Bašta, the ruling slope was 0.636, still significant but less extreme. When the municipalities are combined, the pooled coefficient settles at 0.911. That pooled estimate does not erase the local differences. Rather, it shows that once all three municipalities are considered together, the broader pattern remains strongly suspicious: turnout continues to benefit the ruling side in a steep and highly systematic way, even if the combined slope is moderated somewhat by the less extreme Bajina Bašta case.
This result also fits well with the earlier sections of the combined report. The ordinary turnout analysis already showed that higher turnout was more favorable to the ruling side than to the opposition in the pooled data. The broader graphical turnout analysis across multiple election cycles also suggested a suspicious asymmetry. The current Russian-school regression sharpens that conclusion further. It shows that turnout is not merely correlated with a better ruling result; it is converted into ruling support at a rate close to one-for-one, while the opposition shows virtually no turnout-based gain at all. That makes this section one of the strongest pieces of cumulative evidence in the combined report.
6.3 Limitations and caution
Even so, this method should not be treated as self-sufficient proof. A steep and highly significant positive slope is a strong forensic indicator, but it does not by itself reveal the concrete mechanism. In principle, one could imagine powerful organizational mobilization, local clustering of particularly loyal ruling-party voters, or other asymmetries that would generate a strong positive relationship. What makes the pooled result suspicious is not merely that the ruling slope is positive, but that it is very close to 1, highly significant, and accompanied by a flat, non-significant opposition slope.
At the same time, the pooled result should be interpreted more carefully than the Aranđelovac or Kula cases individually. Because the coefficient remains below 1, it does not produce the same direct arithmetic impossibility seen in the strongest local anomalies. The correct formulation is therefore not that the combined graph proves fraud mechanically, but that it shows a highly unusual and strongly asymmetric turnout-conversion pattern in favor of the ruling side.
It is also important to remember that this tool measures vote share relative to registered voters, not relative to valid votes cast. That is precisely why the coefficient (\beta) is so informative. But it also means that the interpretation must be explained clearly, so that readers understand why a coefficient close to 1 is already highly problematic in forensic terms, even if it does not exceed that threshold.
6.4 Conclusion
Yes, this turnout-based forensic regression supports the hypothesis that the ruling side across the three municipalities benefited disproportionately from higher turnout. The key result is the estimated ruling-bloc slope of \(\beta = 0.911\), which is highly statistically significant and very close to 1, while the opposition slope of \(\beta = -0.0179\) is effectively zero and not statistically significant. This means that across the combined dataset, higher turnout was systematically converted into support for the ruling side, whereas the opposition showed no comparable gain. The result is somewhat less extreme than the sharpest individual municipal anomalies, but it still provides a strong additional warning sign in the combined forensic analysis.
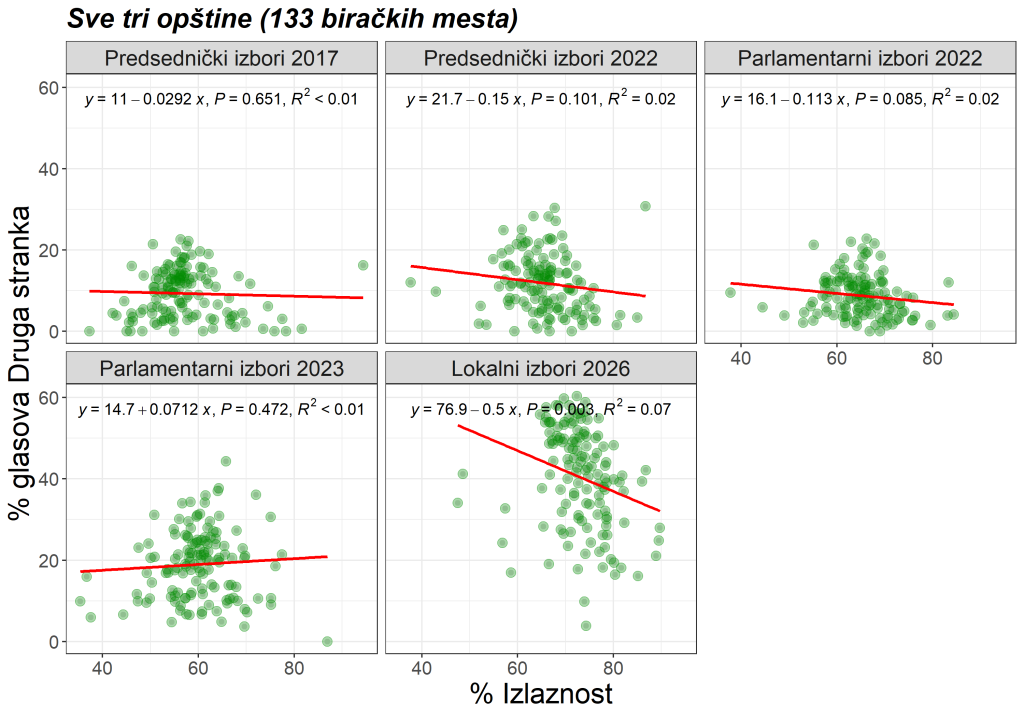
7. Graphical analysis of vote shares by turnout
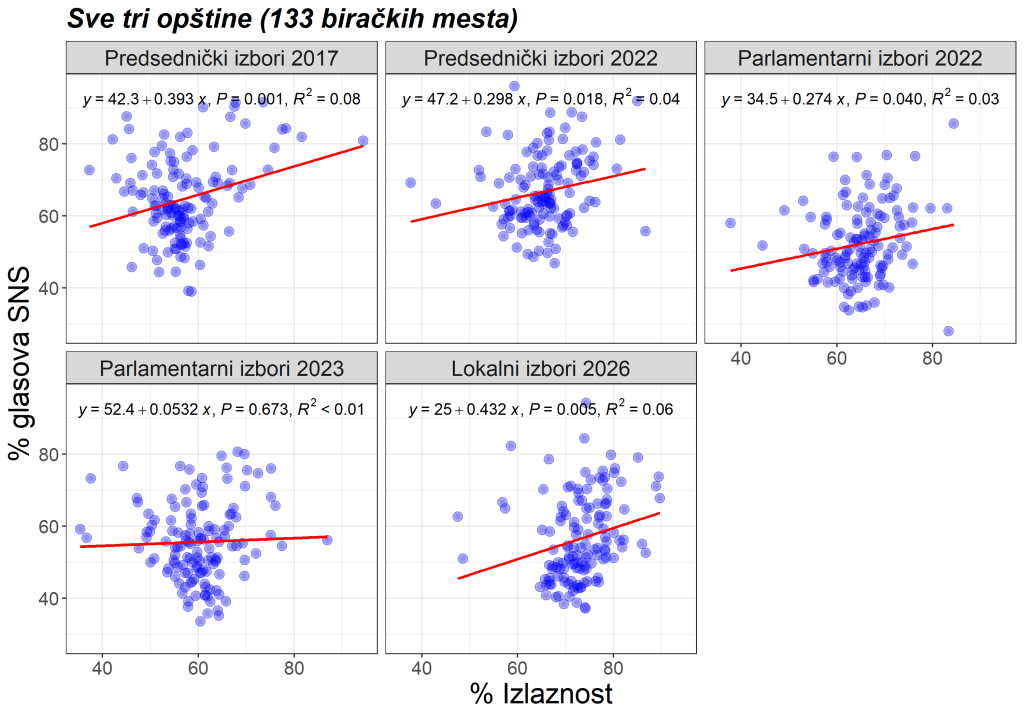
According to Figure 3 only the 2023 parliamentary election shows a positive but only marginally significant relationship between turnout and the winner’s vote share. In all other elections shown, the relationship is positive and highly statistically significant. Such an outcome, in this election-forensics framework, is consistent with the possibility of manipulation when one party, the ruling party in this case, benefits from higher turnout.
The opposition graph is equally revealing. According to Figure 4 the slope is predominantly negative, meaning that as turnout rises the opposition’s share of valid votes falls. In all earlier elections except the latest local election, that relationship is not statistically significant. But at the 2026 local election, the relationship becomes strongly negative and highly statistically significant. According to the logic of this forensic tool, that is the kind of result one may observe when one party does not merely gain absolute votes from turnout growth, but also increases its relative advantage under rising participation. This is one of the strongest cross-municipality warning signs in the entire pooled file.
The pooled graphical analysis therefore has an important integrative value. It shows that, even if turnout did not look equally suspicious in each municipality separately, the broader pattern across the three municipalities combined points toward a recurring asymmetry: higher turnout tends to coincide with relatively stronger ruling-party performance and weaker opposition performance, especially in the latest local-election context.
8. Klimek curves
The pooled sample includes 133 polling stations, which is an improvement over the individual municipalities, but even in the pooled setting the number of observations becomes thin at the highest turnout levels, it remains difficult to draw strong conclusions from the Klimek curves alone.
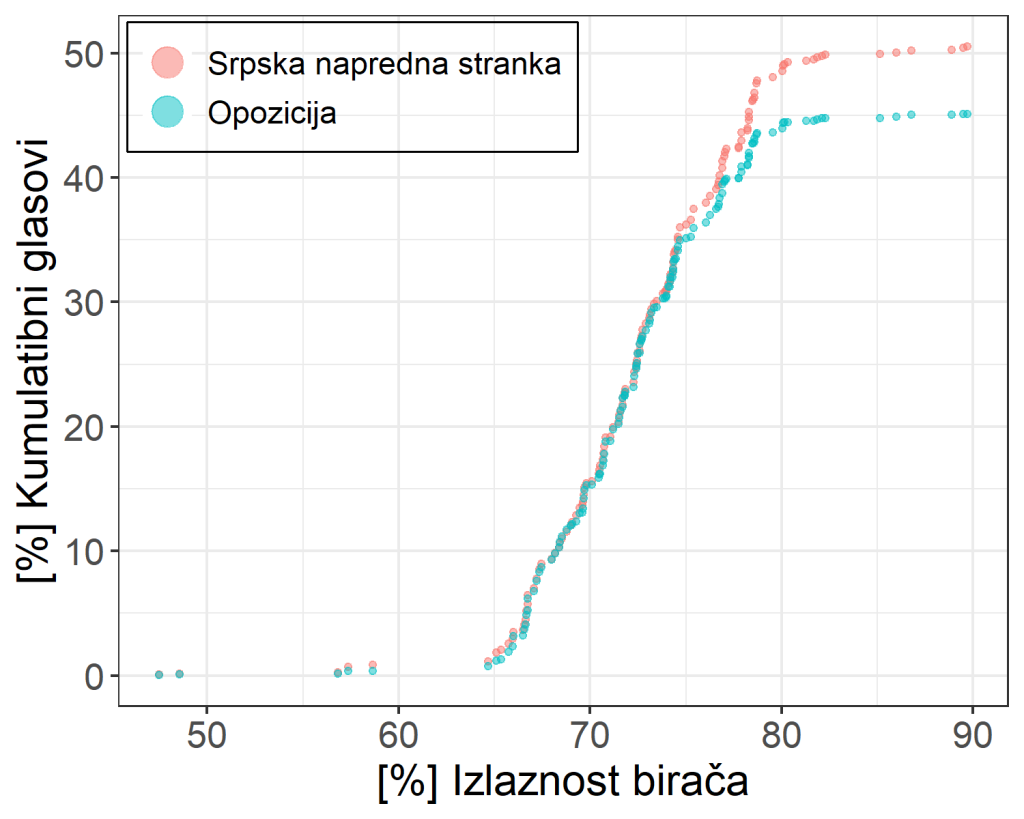
That should remain the central interpretive message. The pooled Klimek curves are more informative than the separate municipal ones, but they are still not decisive. They may support the broader cumulative impression, but they should not be used as a standalone basis for strong claims of manipulation.
9. Election fingerprints
The election-fingerprint analysis becomes more meaningful in the pooled setting because the larger number of polling stations produces a more stable 2D structure. Both the 2D histogram/heat map and the marginal distributions should be interpreted, with special emphasis on the smudge elongated toward high winner percentages. In a fair and free election, one expects a more compact central cloud. In a more suspicious setting, the cloud may stretch toward the upper-right corner or develop asymmetries in the margins that suggest layered electoral environments.
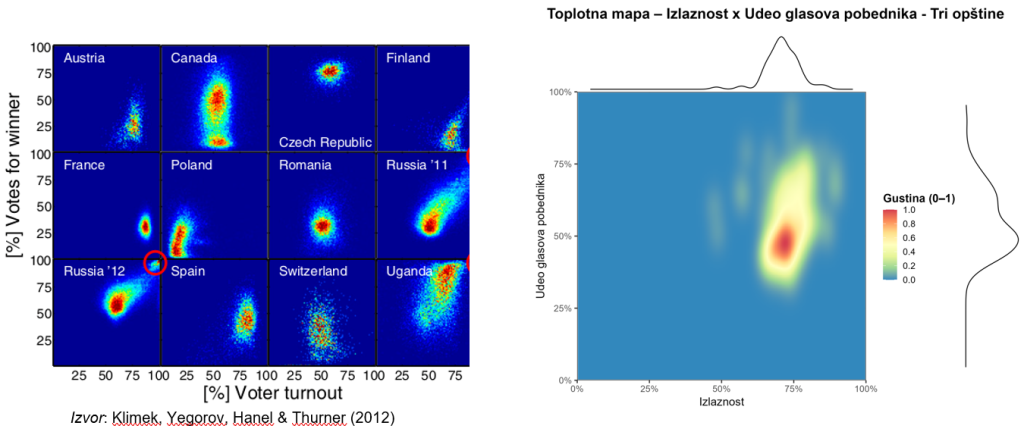
The pooled file clearly invites interpretation of the elongated smudge toward high winner shares as suspicious. This does not make the fingerprint graph conclusive by itself. But in the pooled setting it becomes more persuasive than in any one municipality alone because the graphical structure is less vulnerable to extreme small-sample instability. That gives the fingerprint analysis a more important supporting role in the combined report.
10. Finite-mixture model
The finite-mixture results for the three municipalities combined are analytically central and should receive the greatest emphasis in the final report. According to the attached fraud report, the pooled sample of 133 polling stations is divided into 60 “no fraud” stations, 6 “incremental fraud” stations, and 67 “extreme fraud” stations. The corresponding shares of the winner’s total votes are 0.577 for the no-fraud class, 0.018 for the incremental-fraud class, and 0.404 for the extreme-fraud class. The overall pooled fraud share is estimated at 0.4379, meaning about 43.79% of the winner’s votes are associated with the suspicious latent classes under the model.
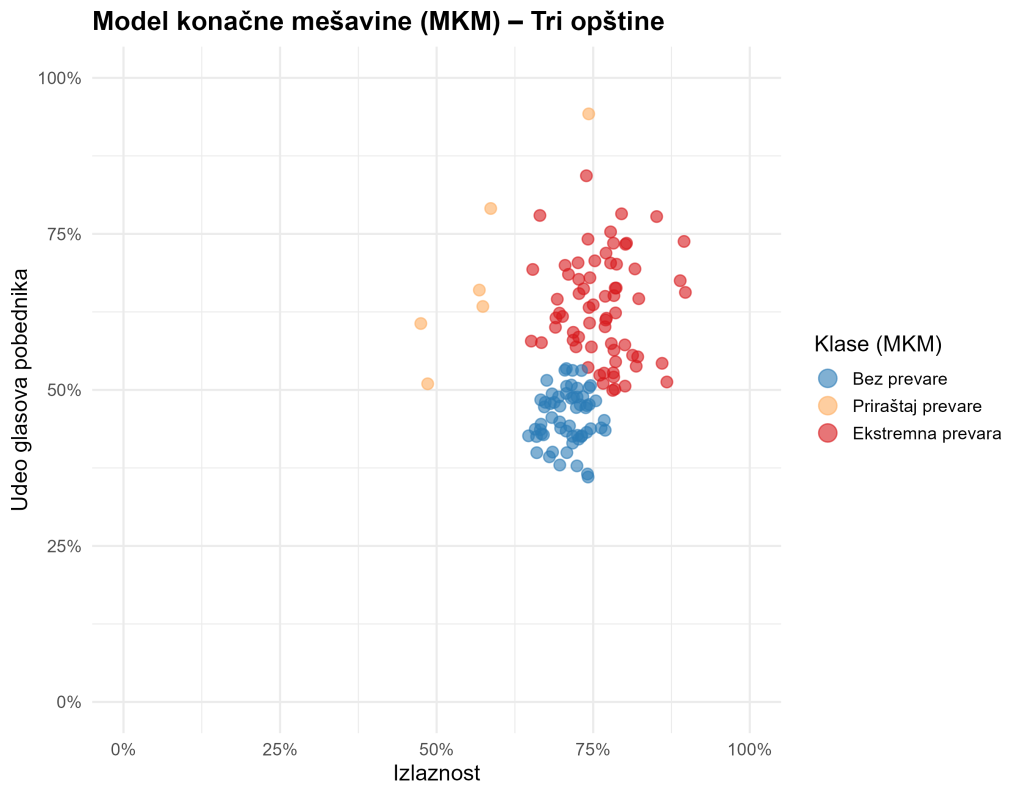
The fitted-parameters provide the substantive shape of those classes. The no-fraud class has mean turnout 71.1% and mean winner share 45.8%. The incremental-fraud class is quite small (Pi = 0.071) but shows a much higher mean winner share (67.1%) at lower mean turnout (62.5%), while the extreme-fraud class is large (Pi = 0.490) and has both high turnout (76.5%) and high winner share (62.5%). In Mebane’s language, incremental fraud corresponds to more moderate but systematic distortions, while extreme fraud corresponds to more concentrated winner inflation associated with especially favorable turnout–winner environments. The pooled class structure is therefore strongly suspicious, especially because the extreme-fraud class is both large and electorally consequential.
This pooled result is especially valuable because it puts the municipalities into a common perspective. Bajina Bašta contributed the most extreme finite-mixture signal at the municipal level. Kula also looked strongly suspicious, while Aranđelovac was substantial but somewhat less extreme. The pooled fraud share of 43.79% therefore does not simply average away the extremes; instead, it shows that once the municipalities are combined, a large and non-trivial suspicious structure remains. This is why the conclusion of the combined report should place particular emphasis on the finite-mixture model.
At the same time, the usual caution remains necessary. The fraud-share estimate is not a legal count of fraudulent ballots. It is a model-based measure of how much of the winner’s vote is associated with suspicious latent classes under the assumptions of the finite-mixture model. But even with that qualification, 43.79% is analytically substantial. In the pooled context, it is one of the strongest pieces of evidence that the combined local-election environment was not fully regular.
11. Executive Summary
Data and preparation
This section analyzes the pooled polling-station dataset for the 2026 local elections in Aranđelovac, Bajina Bašta, and Kula. The combined dataset contains 133 polling stations and allows a more stable application of election-forensics tools than the separate municipal datasets. The analysis combines a correlation matrix, regression models, turnout graphics, Klimek curves, election fingerprints, and a finite-mixture model.
Turnout and vote shares
Higher turnout appears to have been more favorable to the ruling side than to the opposition in the pooled sample. The key correlations are r = 0.24 for turnout and %SNS, and r = −0.26 for turnout and %Opozicija. While these are only moderate coefficients, they point in a consistent direction and fit the later graphical evidence.
Voting outside the polling station and vote shares
Outside voting is one of the clearest suspicious channels in the pooled analysis. Its correlation with the ruling percentage is 0.65, while its correlation with the opposition percentage is −0.64. In the full regression model, the coefficient on outside voting is 1.190, strongly positive and highly significant, while model fit rises sharply.
Invalid ballots and vote shares
Invalid ballots are also one of the strongest suspicious indicators. They are negatively correlated with the ruling percentage (r = −0.55) and positively correlated with the opposition percentage (r = 0.56). The regression coefficients on invalid ballots remain large, negative, and highly significant across all three models (−0.912, −0.868, −0.471), even after outside voting is introduced.
Turnout-based forensic regression in the Russian-school tradition
In the additional check based on the Russian school of election forensics, the combined dataset for Aranđelovac, Bajina Bašta, and Kula shows that turnout systematically benefited the ruling side more than the opposition. The estimated slope coefficient for the ruling bloc is \(\beta = 0.911\) and is highly statistically significant, meaning that higher turnout was associated with an unusually strong increase in ruling-party support relative to the number of registered voters. By contrast, the opposition slope is essentially zero and statistically insignificant. Taken together, this suggests that across the three municipalities turnout was not functioning as a politically neutral participation process, but as an asymmetric channel that consistently favored the ruling side.
Graphical analysis by turnout
The pooled turnout graphics are strongly suggestive. According to the attached notes, the winner’s turnout relationship is positive and highly significant in all elections shown except the 2023 parliamentary election, where it is only marginally significant. The opposition’s turnout relationship becomes strongly negative and highly significant in the 2026 local election, which is one of the strongest warning signs in the combined analysis.
Klimek curves
The pooled Klimek curves are more informative than the municipal ones, but they are still too fragile at the highest turnout levels to support strong standalone claims. They may reinforce the broader suspicious impression, but should not be given decisive independent weight.
Election fingerprints
The fingerprint analysis becomes more persuasive in the pooled setting. The most important visual feature is the smudge elongated toward high winner percentages, which is consistent with a suspiciously distorted joint distribution of turnout and winner share. It is not conclusive alone, but it fits the broader cumulative pattern.
Finite-mixture model
The finite-mixture model is analytically central. The pooled fraud-share estimate is 43.79%, with a large extreme-fraud class and a meaningful suspicious structure overall. This is methodologically qualified but still one of the strongest indicators in the combined report.
Overall assessment
Taken together, the pooled findings provide serious grounds for suspicion that the local elections in these three municipalities were not conducted under fully fair and neutral competitive conditions. The strongest suspicious elements are the combined invalid-ballot structure, the very strong outside-voting effect, the turnout graphics, and the finite-mixture model. Among the three municipalities, Bajina Bašta appears the most strongly suspicious overall, Kula also shows substantial warning signs, and Aranđelovac remains clearly problematic though somewhat less extreme in the pooled perspective. The combined analysis therefore supports the conclusion that these local elections, taken together, exhibit a meaningful and non-trivial pattern consistent with electoral distortion and possible manipulation.
12. Methodological appendix
This report uses seven complementary election-forensics approaches. Correlation analysis serves as an initial screening device for systematic polling-station-level relationships. Regression analysis tests whether those relationships remain when multiple explanatory variables are considered jointly. Turnout graphics examine whether higher participation disproportionately benefits the ruling side and harms the opposition. Klimek curves assess whether cumulative vote growth resembles a democratic plateau or a more suspicious acceleration pattern. Election fingerprints inspect the joint distribution of turnout and winner share, together with the shape of their marginal distributions. Finally, Mebane’s finite-mixture model classifies polling stations into latent regular and suspicious types and estimates the winner’s vote share associated with each class. In this combined report, particular emphasis falls on the finite-mixture model because it not only suggests whether suspicious patterns are present, but also distinguishes between incremental and extreme fraud-type classes and provides an aggregate estimate of the suspicious share of the winner’s vote.
Director of Wellington based My Statistical Consultant Ltd company. Retired Associate Professor in Statistics.
Has a PhD in Statistics and over 45 years experience as a university professor, consultant, international researcher and government advisor.