1. Local Context of the 2026 Elections in Bajina Bašta
Bajina Bašta is a small western-Serbian municipality with a pronounced split between the town and a broad rural hinterland. The 2022 census records just over 23,500 inhabitants, with 8,971 in the urban settlement and 14,562 in other settlements. That structure alone suggests that later electoral analysis should not assume a single local pattern. A municipality with one modest urban centre and a large number of surrounding settlements typically contains strong spatial differences in access to institutions, labour markets, and local political mediation.
Geographically and economically, Bajina Bašta stands out because it combines border-river location, tourism visibility, and energy infrastructure. The local tourism organization presents the municipality through Tara, the Drina, and related tourism assets, while EPS describes the Bajina Bašta branch as part of the Drinsko-Limske hydropower system and emphasizes the importance of the pumped-storage hydro plant for Serbia’s electricity security. This gives Bajina Bašta a mixed profile: part mountain and river tourism area, part energy-linked locality, part dispersed rural municipality. In such places, electoral behaviour may reflect not only town–village differences, but also uneven dependence on tourism, public systems, and infrastructure-related employment.
The official municipal pages also point to institutional continuity, with Milenko Ordagić and Dejan Mlađenović occupying the top local executive and assembly roles. Bajina Bašta was one of the ten local units included in CRTA’s 2026 observation framework, meaning that its election should be read not as an isolated local contest but as part of a politically tense and nationally watched local cycle. For later forensic analysis, the main expectation is that the municipality may display differentiated patterns between the town, tourism-facing areas, and the wider village network, rather than one uniform municipal signature.
2. Election lists and official result summary
The 2026 local elections in Bajina Bašta were contested by six lists: Aleksandar Vučić – Bajina Bašta, naša porodica!, Ujedinjeni za Bajinu Baštu, Zdrava Srbija – Milan Stamatović, Socijaldemokratska partija Srbije – Marija Milosavljević, Izađi – Izbori se za Bajinu Baštu – Srpski liberali, and Nestranački pokret za Bajinu Baštu.
Table 1. Official election result in Bajina Bašta
| Electoral list | % votes | Mandates |
| Aleksandar Vučić – Bajina Bašta, naša porodica! | 52.37 | 25 |
| Ujedinjeni za Bajinu Baštu | 40.33 | 20 |
| Zdrava Srbija – Milan Stamatović | 1.79 | 0 |
| Socijaldemokratska partija Srbije – Marija Milosavljević | 2.25 | 0 |
| Izađi – Izbori se za Bajinu Baštu – Srpski liberali | 0.43 | 0 |
| Nestranački pokret za Bajinu Baštu | 0.62 | 0 |
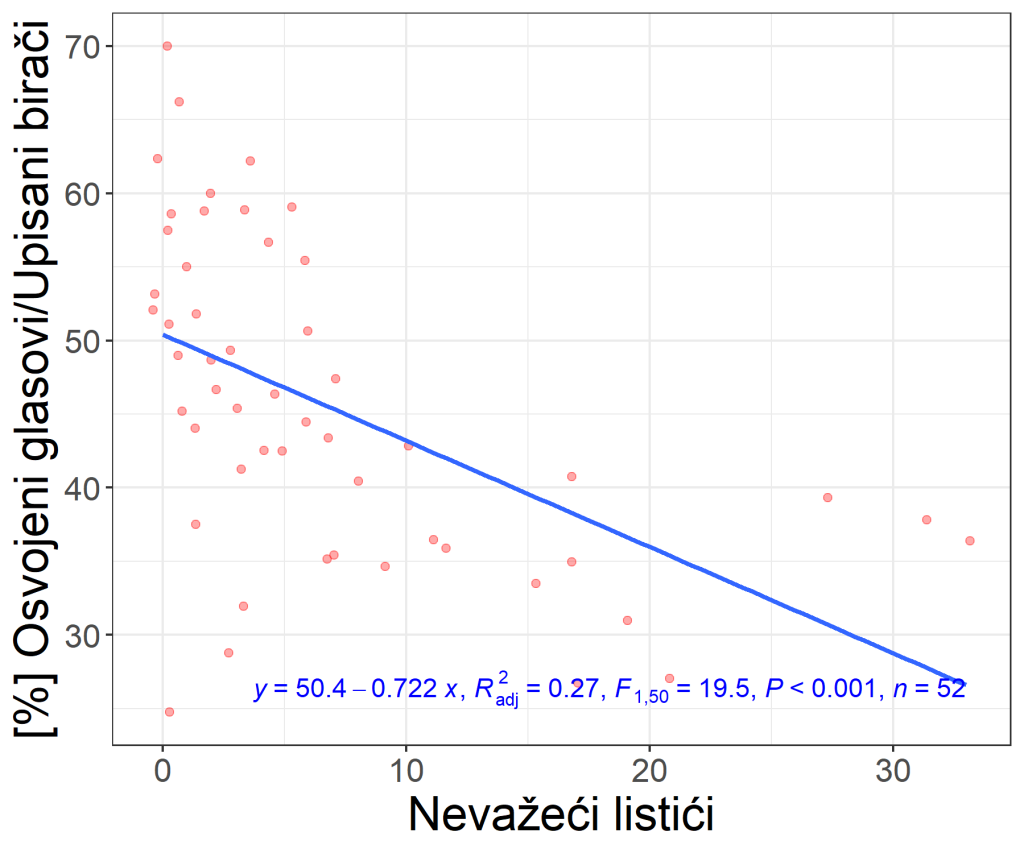
The official result shows a clearly dominant two-bloc contest, though somewhat less tightly compressed than in Aranđelovac. The ruling list won 52.37% of the vote and 25 mandates, while Ujedinjeni za Bajinu Baštu won 40.33% and 20 mandates. All other lists remained below the threshold for assembly representation. This configuration matters for forensic interpretation because strong bipolar competition often sharpens the statistical relationship between the main winner and the main challenger, while smaller lists tend to play only marginal roles unless they are territorially or strategically distinctive.
3. Analytical framework
This report uses the same multi-method election-forensics framework as in the previous section. It combines a correlation matrix, regression analysis, graphical analysis of turnout and vote shares across several election cycles, Klimek-style cumulative curves, election fingerprints, and Mebane’s finite-mixture model. The aim is not to claim that any single method can prove fraud on its own. Rather, the purpose is to examine whether different indicators converge and whether the local structure of the result looks more consistent with ordinary competitive elections or with a more distorted and politically asymmetric environment.
The municipality has 52 polling stations, which is somewhat more favorable for forensic analysis than Aranđelovac, but still modest for some of the more demanding graphical and mixture-model techniques. This is especially relevant for Klimek curves, election fingerprints, and finite-mixture estimation. As before, the correct standard is cumulative interpretation. Small-sample methods should not be treated as mechanically conclusive. But when they point in similar directions, they can still provide meaningful evidence about the structure of the election result.
4. Turnout and vote shares
Did higher turnout benefit the ruling party or the opposition?
4.1 Intuitive logic
In a free and fair election, turnout is not expected to systematically advantage one side and disadvantage the other across polling stations. Higher participation may occur for many ordinary reasons, but one does not usually expect a clear and repeated pattern in which rising turnout translates into stronger support for the ruling side and weaker support for the opposition. From a forensic perspective, such a pattern becomes more interesting when it is reinforced by several methods and when it departs from what the same locality shows in other election cycles.
4.2 Results and interpretation
The correlation matrix for Bajina Bašta paints a notably different picture from Aranđelovac. We shaded positive significant correlation coefficients in green, and negative significant ones in red. The ruling list’s vote share (%SNS) has an almost zero correlation with turnout, at r = 0.02. The main opposition list (%Ujedinjeni) is similarly unrelated to turnout, with r = −0.03. These coefficients are so small that they do not support any claim that higher turnout systematically helped either the ruling side or the main opposition in the 2026 local election. This is an important negative finding. In forensic work, the absence of a suspicious pattern is just as analytically valuable as its presence. Here, turnout does not appear to have functioned as an asymmetric mobilization channel in the way it did in Aranđelovac.
Table 2. Correlation matrix
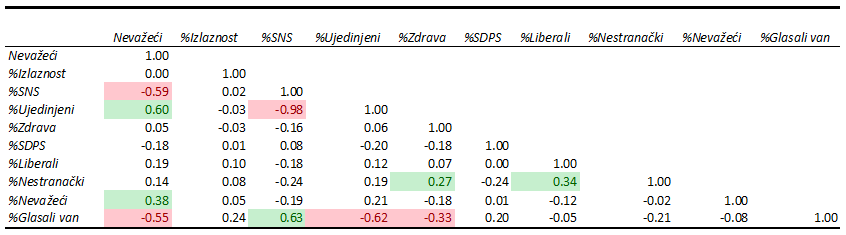
The internal structure of the main electoral contest is still highly polarized. The correlation between %SNS and %Ujedinjeni is r = −0.98, indicating that the local race was overwhelmingly structured around these two blocs. Where the ruling side did better, Ujedinjeni did worse, and vice versa. As in Aranđelovac, this should not be overread as direct voter substitution at the individual level. It is above all a compositional feature of a strongly bipolar local contest. Still, it clearly identifies Ujedinjeni za Bajinu Baštu as the principal anti-incumbent competitor and confirms that the election was decided primarily within that central governing-versus-opposition axis.
The smaller lists played much weaker and more fragmented roles. Zdrava Srbija has essentially no relationship with turnout (r = −0.03) and only a weak negative correlation with SNS (r = −0.16). SDPS is also almost unrelated to turnout (r = 0.01) and only weakly positively related to SNS (r = 0.08). Liberali and Nestranački show similarly limited and mixed patterns. The strongest correlation among the smaller actors is between %Liberali and %Nestranački, at r = 0.34, and between %Zdrava and %Nestranački, at r = 0.27. These figures may suggest some local overlap in support environments, but they are not strong enough to support a confident strategic classification. As in the Aranđelovac case, claims that any of these lists acted as quasi-opposition formations would require evidence beyond correlations alone.
What is more revealing is the relationship between turnout and the broader electoral environment. Turnout is effectively unrelated to invalid ballots in both raw and percentage form: r = 0.00 with the number of invalid ballots and r = 0.05 with the percentage of invalid ballots. It is only weakly related to voting outside the polling station (r = 0.24). This contrasts sharply with the Aranđelovac pattern, where turnout was more clearly embedded in a suspicious cluster involving invalid ballots and outside voting. In Bajina Bašta, turnout behaves much more like an ordinary participation measure. That observation fits well with the later graphical evidence, which also suggests that turnout was generally not politically decisive in the expected forensic sense.
The overall implication is therefore relatively restrained. In Bajina Bašta, turnout does not appear to have been systematically transformed into a channel of ruling-party advantage. This does not prove that the election was clean in every respect. But it does mean that the turnout mechanism, taken by itself, looks much less suspicious than in the Aranđelovac case.
4.3 Limitations and caution
As always, correlation is only a screening tool. It does not identify causal mechanisms and cannot distinguish between neutral participation, organization-driven mobilization, or illicit intervention. The near-perfect −0.98 correlation between SNS and Ujedinjeni should again be understood mainly as a compositional feature of a two-bloc election, not as literal evidence of one-for-one voter transfer. Smaller-list behavior should also be interpreted carefully, because low vote shares often produce unstable or noisy local correlations.
4.4 Conclusion
No, the Bajina Bašta results do not support the conclusion that higher turnout systematically benefited either the ruling list or the main opposition. The key coefficients, r = 0.02 for turnout and SNS, and r = −0.03 for turnout and Ujedinjeni, are too close to zero to sustain such a claim. In forensic terms, this is closer to the pattern expected in a more ordinary electoral setting, at least with respect to turnout.
5. Voting outside the polling station and vote shares
Did voting outside the polling station benefit the ruling candidate?
5.1 Intuitive logic
Voting outside the polling station is one of the most sensitive administrative channels in any election. It is necessary for enabling participation by voters who cannot physically come to vote, but it is also less transparent than ordinary in-person voting. In forensic analysis, the question is whether this type of voting looks politically neutral or whether it is disproportionately associated with stronger performance by the ruling side.
5.2 Results and interpretation
In Bajina Bašta, this channel is statistically much more important than turnout itself. The correlation matrix shows that the percentage voting outside the polling station (%Glasali van) is strongly positively correlated with %SNS, at r = 0.63, and strongly negatively correlated with %Ujedinjeni, at r = −0.62. These are large coefficients. They indicate that polling stations with more outside-the-polling-station voting tended also to be polling stations where the ruling side did substantially better and the main opposition substantially worse. This is precisely the kind of asymmetry that makes this variable forensically significant.
The regression models strengthen that interpretation. In Model 1, the coefficient on invalid ballots is −0.946, with R² = 0.346, indicating that fewer invalid ballots are associated with higher SNS support. In Model 2, after turnout is added, the invalid-ballot coefficient remains unchanged at −0.946, while turnout itself is essentially zero and not statistically significant (0.034). This is already an important result: turnout adds almost nothing to the explanatory structure, which is consistent with the weak turnout correlations in the matrix. The real shift comes in Model 3, when %Glasali van is introduced. It enters as 0.945, positive and highly significant, while the invalid-ballot coefficient weakens from −0.946 to −0.526 and the model fit rises sharply to R² = 0.491.
Table 3. Regression analysis (dependent variable %SNS)
| Model 1 | Model 2 | Model 3 | |
| (Intercept) | 68.208*** | 65.692*** | 69.476*** |
| (1.922) | (13.683) | (12.246) | |
| Invalid | -0.946*** | -0.946*** | -0.526* |
| (0.184) | (0.186) | (0.201) | |
| %Turnout | 0.034 | -0.147 | |
| (0.181) | (0.168) | ||
| %Outside voting | 0.945*** | ||
| (0.256) | |||
| Num.Obs. | 52 | 52 | 52 |
| R2 | 0.346 | 0.347 | 0.491 |
| R2 Adj. | 0.333 | 0.320 | 0.459 |
| p < 0.05, ** p < 0.01, *** p < 0.001 | |||
That change is substantively important. It suggests that outside-the-polling-station voting captures a major part of the local asymmetry that simpler models were previously attributing mainly to invalid ballots. The matrix supports this interpretation. Outside voting is negatively correlated with the number of invalid ballots (r = −0.55) and also negatively correlated, though only weakly, with the percentage of invalid ballots (r = −0.08). So the polling stations with more outside voting tend also to have fewer invalid ballots and a higher ruling-party share. Once outside voting is added to the regression, invalid ballots still matter, but they no longer appear to be the sole or dominant suspicious channel. Instead, the two variables seem to describe overlapping aspects of the same local electoral structure.
The likely interpretation is that outside voting in Bajina Bašta was not politically neutral. That does not automatically mean direct manipulation. There are also non-fraudulent possibilities, including more effective mobilization of elderly or immobile pro-government voters, stronger local organization, or patterns of settlement structure that made home voting more relevant in ruling-leaning areas. But from a forensic perspective, the core point is that this administrative channel systematically coincided with better ruling-party performance and worse opposition performance.
5.3 Limitations and caution
The correlation and regression evidence here is stronger than the turnout evidence, but it still does not identify the concrete mechanism. With only 52 polling stations, omitted variables remain possible. In addition, outside-the-polling-station voting may partly reflect demographic structure or rurality rather than manipulation alone. The correct conclusion is therefore not that abuse has been proven, but that this channel is sufficiently aligned with ruling-party advantage to deserve serious procedural scrutiny.
5.4 Conclusion
Yes, the Bajina Bašta results support the hypothesis that voting outside the polling station benefited the ruling candidate. The strongest numerical indicators are the 0.63 correlation between %Glasali van and %SNS, the −0.62 correlation with %Ujedinjeni, and the 0.945 coefficient in Model 3. Taken together, they make outside voting one of the clearest suspicious channels in this municipality.
6. Invalid ballots and vote shares
Did invalid ballots benefit the ruling candidate?
6.1 Intuitive logic
Invalid ballots are important in election forensics because they can mark the boundary between ordinary voting error, administrative judgment, and politically consequential ballot handling. A negative relationship between the winner’s vote share and invalid ballots may suggest that the winner performs better where fewer ballots are declared invalid. In theory, this may happen because questionable ballots are counted more favorably for the ruling side, or because the distribution of invalid ballots indirectly reduces the competitive weight of opposing votes.
6.2 Results and interpretation
The Bajina Bašta correlation matrix offers a clear starting point. The ruling list’s vote share (%SNS) is negatively correlated with the number of invalid ballots at r = −0.59. The main opposition list (%Ujedinjeni) shows the opposite pattern, with a positive correlation of r = 0.60 with invalid ballots. This is a stronger contrast than in Aranđelovac. In substantive terms, polling stations with more invalid ballots tended to have a lower ruling-party share and a higher opposition share; polling stations with fewer invalid ballots tended to show the opposite. This is a classic Mebane-type signal: a suspiciously favorable relationship between low invalid-ballot counts and strong performance by the winner.
The percentage of invalid ballots behaves less dramatically, but still not neutrally. Its correlation with %SNS is r = −0.19, while its correlation with %Ujedinjeni is r = 0.21. These are much weaker than the raw invalid-ballot count, which suggests again that the raw number carries more of the meaningful forensic information. The percentage of invalid ballots seems too diluted by denominator effects to provide the same degree of interpretive sharpness. For Bajina Bašta, as for Aranđelovac, the more important forensic indicator is therefore the number of invalid ballots rather than their share alone.
The regression results reinforce this reading quite strongly. In both Model 1 and Model 2, the invalid-ballot coefficient is −0.946. That stability is notable. It suggests that adding turnout contributes virtually nothing to the explanatory story, while the invalid-ballot effect remains large and highly significant. Since the dependent variable is the percentage of SNS votes, a coefficient of −0.946 can be read in the standard way requested by the attached notes: reducing the number of invalid ballots by one is associated with an increase of roughly 0.95 percentage points in the ruling candidate’s share, as measured on the underlying base used in the analysis. With R² = 0.346 in Model 1 and R² = 0.347 in Model 2, this is not a trivial association.
But the story does not end there. In Model 3, once outside voting is included, the invalid-ballot coefficient falls to −0.526. It remains statistically significant, unlike in Aranđelovac, but it is substantially reduced in magnitude. This is an important result. It suggests that outside voting explains part, but not all, of the suspicious invalid-ballot structure. In other words, invalid ballots remain independently relevant in Bajina Bašta even after controlling for outside voting. The matrix supports that interpretation: invalid ballots and outside voting are negatively correlated (r = −0.55), but not so completely that one absorbs the other. This makes Bajina Bašta somewhat different from Aranđelovac. Here, invalid ballots appear to retain a stronger autonomous forensic role.
The most careful interpretation is therefore dual. First, the data are compatible with the hypothesis that lower invalid-ballot counts were electorally beneficial to the ruling side. Second, this relationship is partly intertwined with the outside-voting channel but not entirely reducible to it. That makes the invalid-ballot pattern in Bajina Bašta both stronger and more independently suspicious than in the Aranđelovac case.
6.3 Limitations and caution
Even so, invalid-ballot analysis remains indirect. The coefficients do not tell us whether ballots were intentionally reclassified, administratively miscounted, or simply patterned by another local factor. The sample remains modest. And without line-by-line ballot-level evidence, no regression can prove the mechanism. The correct conclusion is therefore forensic and probabilistic, not judicially categorical.
6.4 Conclusion
Yes, the Bajina Bašta results support the proposition that invalid ballots were linked to an outcome favorable to the ruling candidate. The key numerical findings are r = −0.59 between invalid ballots and %SNS, r = 0.60 between invalid ballots and %Ujedinjeni, and a large, negative, highly significant regression coefficient of −0.946 in the simpler models, still remaining significant at −0.526 after outside voting is added. In forensic terms, this is one of the stronger warning signals in the municipality.
7. Turnout-based forensic regression in the Russian-school tradition
Does the turnout structure suggest that the ruling list benefited disproportionately from higher participation?
7.1 Intuitive logic
One of the better-known tools associated with the Russian school of election forensics examines the relationship between turnout and a candidate’s or list’s vote share measured not as a percentage of valid votes, but as a percentage of registered voters at each polling station. Formally, the model can be written as
$$\frac{V}{E} = \beta T + \alpha,$$
where \(T\) denotes turnout, \(V\) the number of votes won by the candidate or list, and \(E\) the number of registered voters at the polling station. The logic of the tool is simple. Under free and fair electoral conditions, one would expect the intercept \(\alpha\) to be approximately equal to the actor’s baseline support, while the slope coefficient \(\beta\) should remain relatively close to zero. That would mean that increasing turnout does not systematically translate into disproportionate gains for one side.
If, however, turnout is artificially inflated in ways that benefit one list, the coefficient \(\beta\) may become clearly positive, may approach 1, or in more extreme cases may even exceed 1. In the most suspicious settings, a slope above 1 implies that every additional 100 voters turning out are associated with more than 100 additional votes for the favored list. That is mathematically implausible under ordinary electoral conditions. At the same time, the principal opponent may show a flat or negative slope, indicating that the additional turnout does not benefit the opposition proportionately and may even coincide with its relative decline.
7.2 Results and interpretation
In Bajina Bašta, the graph shows the following estimated regression for the ruling list Aleksandar Vučić – Bajina Bašta, naša porodica!:
$$\frac{V}{E} = -2.23 + 0.636T,$$
with adjusted \(R^2 = 0.21, F_{1,50} = 15.0, P < .001, n = 52\).
For the opposition list Ujedinjeni za Bajinu Baštu, the estimated regression is
$$\frac{V}{E} = 3.41 + 0.277T,$$
with adjusted \(R^2 = 0.04, F_{1,50} = 2.97, P = .091, n = 52\)
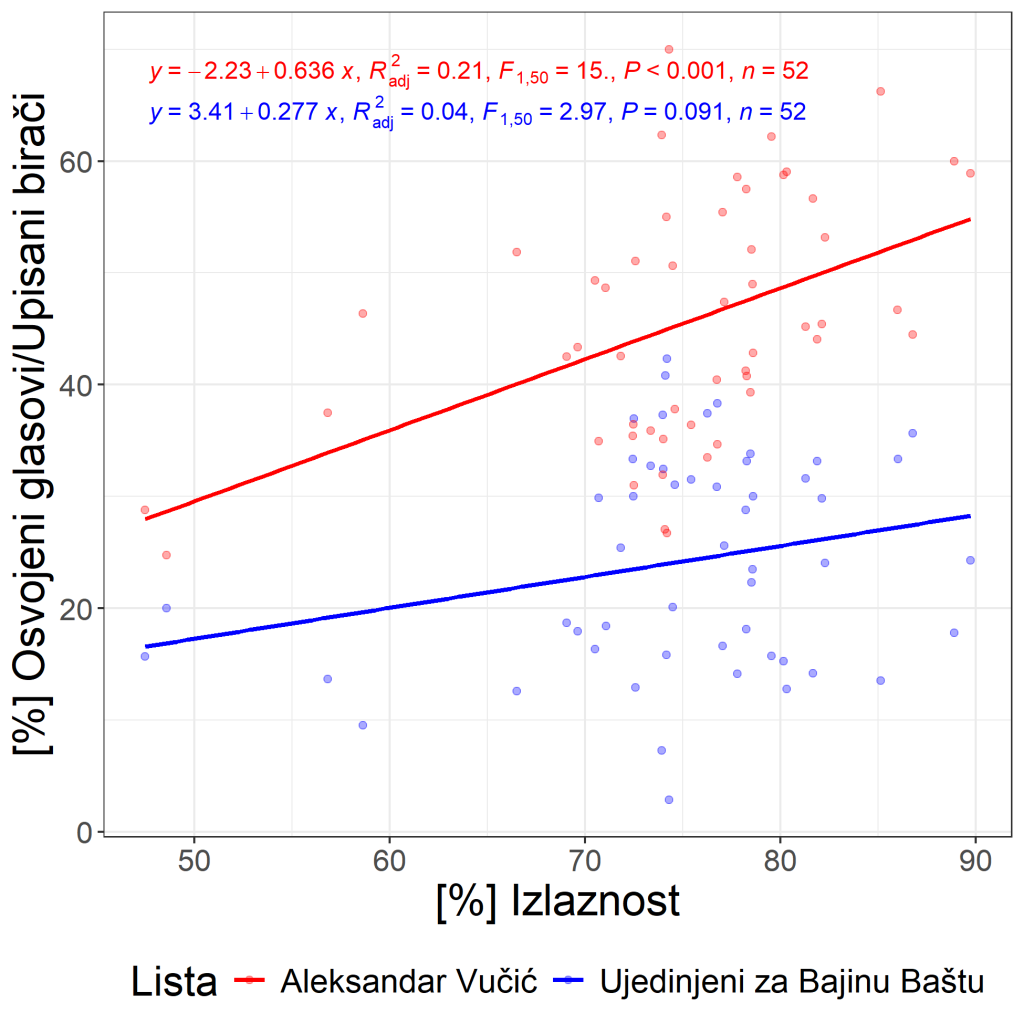
The first point to note is that the ruling-list slope is positive, substantial, and statistically highly significant. The estimate \(\beta = 0.636\) means that a 1-point increase in turnout is associated with a rise of roughly 0.636 percentage points in the ruling list’s vote share measured against the number of registered voters. Put differently, every additional 100 voters participating is associated with about 64 additional votes for the ruling side. Unlike the Aranđelovac case, this slope does not exceed 1, so it does not produce the same kind of arithmetic impossibility. Nevertheless, it still indicates a strong and clearly non-neutral turnout conversion pattern in favor of the ruling list.
The second important point is that the opposition list also has a positive slope, \(\beta = 0.277\), but that coefficient is not statistically significant at conventional levels (\(P = .091\)). This matters for interpretation. The graph does not show a sharply negative opposition response to turnout, as it did directionally in Aranđelovac. Instead, it suggests that higher turnout may have coincided with some increase in opposition support as well, but not in a stable or statistically reliable way. The key asymmetry lies in the fact that the ruling list’s turnout conversion is much steeper, much more systematic, and much more statistically secure.
This makes the Bajina Bašta result analytically different from Aranđelovac. In Aranđelovac, the ruling-list slope exceeded 1, producing one of the strongest anomalies in the entire analysis. In Bajina Bašta, the result is less extreme, but still important. The ruling side clearly benefits from higher turnout, while the opposition does not show a comparably strong and significant gain. In forensic terms, this remains suspicious because turnout is not behaving like a politically neutral participation process. It is behaving like a channel through which the ruling side converts additional turnout into electoral advantage much more effectively than its principal opponent.
This result also fits the broader structure of the Bajina Bašta analysis. Earlier sections showed that simple turnout correlations by themselves were not among the strongest warning signals in this municipality, at least not in the same way as invalid ballots or outside-the-polling-station voting. The present Russian-school regression sharpens that picture. It suggests that even if turnout does not appear overwhelmingly suspicious in every descriptive indicator, the ruling list still converts turnout growth into additional support in a statistically meaningful way. This does not make turnout the single dominant suspicious channel in Bajina Bašta, but it does make it relevant.
7.3 Limitations and caution
This method remains a forensic indicator, not a self-sufficient proof. A positive and significant slope may reflect manipulation, but it may also reflect strong organizational advantage, more effective mobilization of loyal supporters, or settlement-level political heterogeneity. What makes the result suspicious is not simply that the ruling slope is positive, but that it is both substantial and clearly stronger than the opposition’s slope.
At the same time, the Bajina Bašta result should not be overstated. The ruling coefficient, while notable, is still well below 1. That means it does not generate the kind of mathematical impossibility observed in stronger anomaly cases. The opposition coefficient is also positive rather than negative, even though it is not statistically significant. Therefore, the correct interpretation is more moderate than in Aranđelovac: the graph supports the conclusion that turnout was more beneficial to the ruling side, but it does not by itself demonstrate an extreme turnout anomaly.
It is also important to recall that this tool uses vote share relative to registered voters, not relative to valid votes cast. That is precisely why the slope coefficient can be interpreted as a conversion rate from turnout into support. But that same feature also means that readers should be guided carefully through the interpretation, so that they understand why a large positive \(\beta\) is forensically meaningful even when it does not exceed 1.
7.4 Conclusion
Yes, this turnout-based forensic regression supports the hypothesis that the ruling list in Bajina Bašta benefited disproportionately from higher turnout. The key result is the estimated slope of \(\beta = 0.636\) for the ruling list, which is clearly positive and highly statistically significant, whereas the opposition slope of \(\beta = 0.277\) is not statistically significant. This means that higher turnout was converted into additional support for the ruling side in a systematic way, while the opposition did not show a comparably reliable gain. The result is less extreme than in Aranđelovac, but it still strengthens the broader forensic conclusion that turnout in Bajina Bašta was not politically neutral.
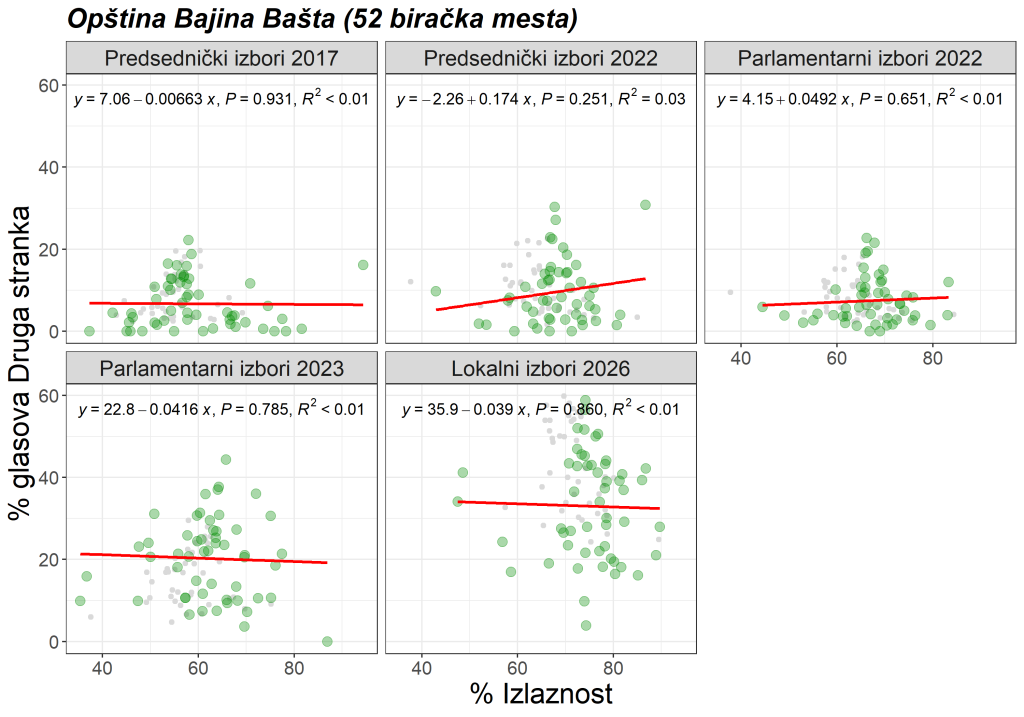
8. Graphical analysis of vote shares by turnout
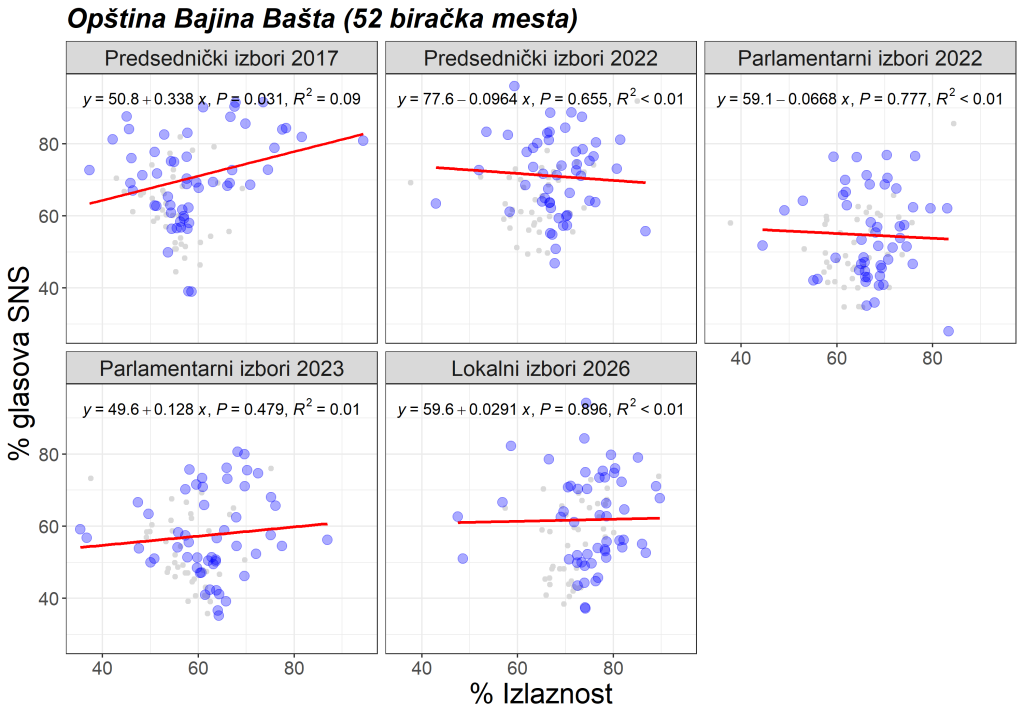
In Bajina Bašta, only the 2017 presidential election shows a positive and statistically significant relationship between turnout and the winner’s vote share. In all other cases, including the 2026 local election, there is no statistically significant relationship between the winner’s vote share and turnout. The same holds for the opposition side: there is no statistically significant relationship at any of the elections shown between opposition vote share and turnout.
This is an important normalizing result. It means that the turnout plots do not support the kind of forensic suspicion that emerged in Aranđelovac. Here, the graphical evidence is closer to what one would expect in a more democratic electoral setting, where turnout does not systematically produce extra gains for one side at the expense of the other. That does not make the election automatically clean overall. But it does mean that turnout, as a graphical forensic indicator, is not a central problem in Bajina Bašta.
9. Klimek curves
The first graph in Figure 5 for all countries, except Russia and Uganda, clearly shows what is expected from Klimek's curves in democracies: reaching a plateau after a certain level of turnout. Unlike them, in non-democratic cases the curves continue to grow up to 100% turnout. The key point is straightforward: in Bajina Bašta, there were 52 polling stations, and the ruling party’s cumulative curve continues to rise after 80% turnout, while the opposition curve reaches a plateau after that point. This is potentially suggestive. However, we should stress that because the number of observations is small, especially at high-turnout polling stations, it is difficult to draw a strong conclusion about manipulation on this basis alone.
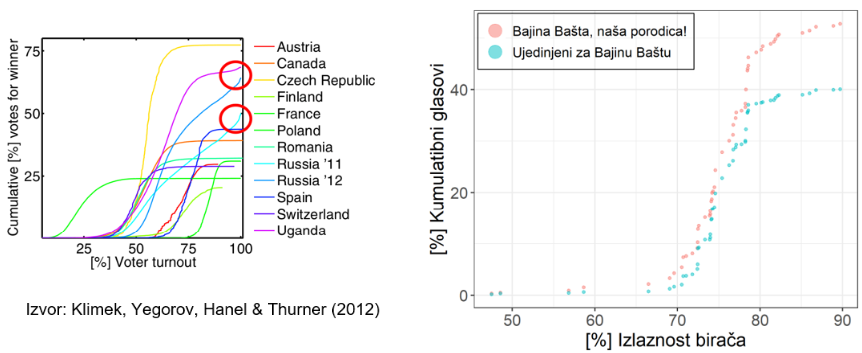
That is the correct balance. The Bajina Bašta Klimek curves are not completely innocuous, because the post-80% divergence is the sort of shape that may raise questions. But the method is too fragile here to support strong standalone claims. At most, it provides a weak supplementary signal.
10. Election fingerprints
The election fingerprints should be interpreted both in terms of the 2D histogram/heat map and in terms of the marginal distributions. Particular attention is drawn to the smudge elongated toward high winner percentages and to the comparison across the last five elections in Bajina Bašta. In a well-behaved democratic election, one expects a more compact central cloud, without strong distortion toward the upper-right corner or abnormal multimodality in the margins. In Bajina Bašta, the local-election fingerprint contains an elongated structure toward high winner shares, and that shape should be read carefully in light of the comparative panels for previous elections.
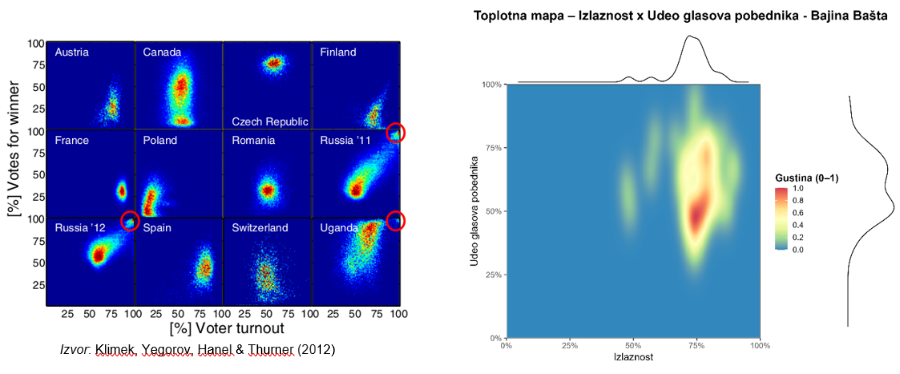
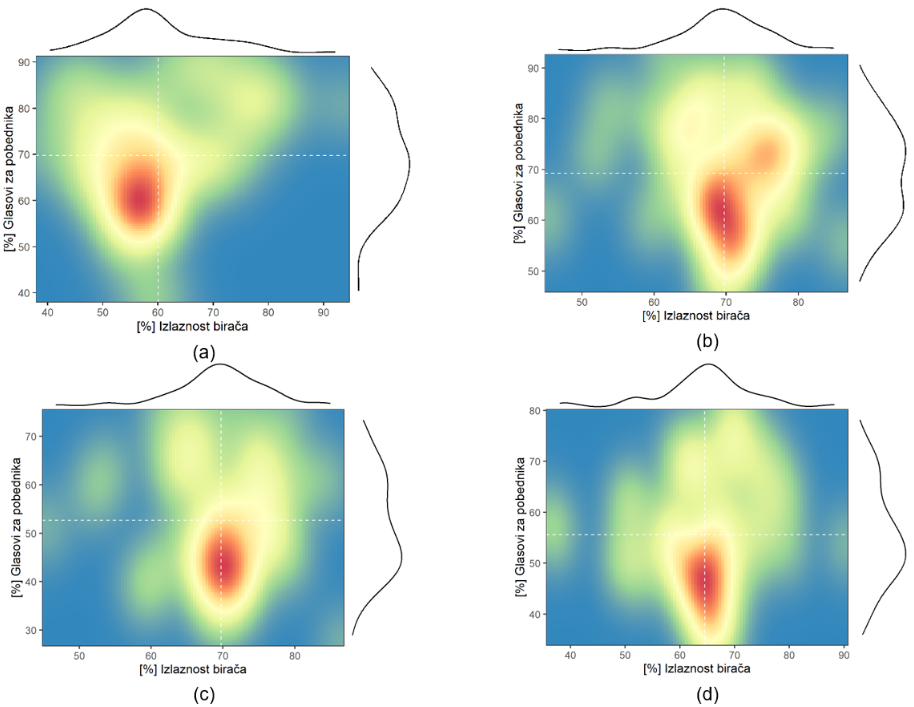
The right interpretive stance is cautious but not dismissive. The fingerprint evidence could not be described as dramatically abnormal in the way that a clearly split or highly inflated pattern would be. But the elongated smudge toward high ruling-party shares does justify concern, especially when read alongside the stronger results for invalid ballots, outside voting, and the finite-mixture model.
11. Finite-mixture model
The finite-mixture results for Bajina Bašta are particularly strong and, in some respects, even more alarming than in the Aranđelovac case. The polling stations fall into three classes: 4 “no fraud” stations, 13 “incremental fraud” stations, and 35 “extreme fraud” stations. The class means are also striking. The no-fraud group has mean turnout 52.9% and mean winner share 64.2%. The incremental-fraud group has mean turnout 73.9% and mean winner share 45.5%. The extreme-fraud group has mean turnout 78.0% and mean winner share 65.8%. Most importantly, the combined fraud share estimate is 0.971, meaning that approximately 97.1% of the winner’s votes are attributed to fraud-type classes in the model output.
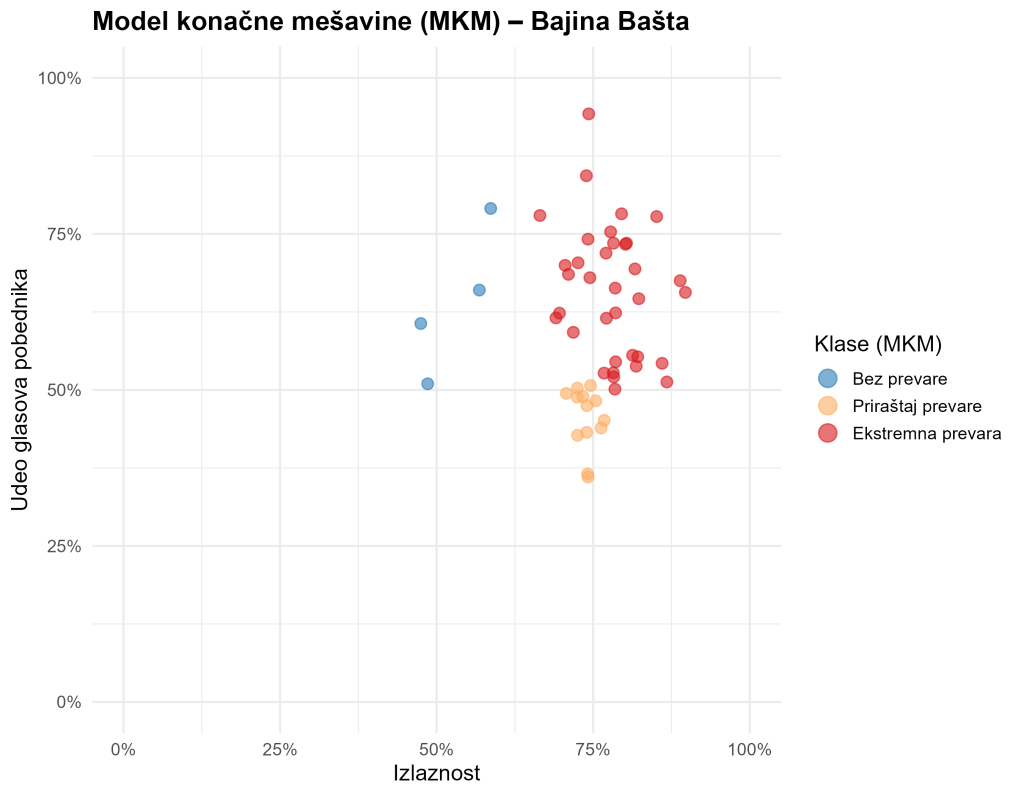
The fitted-parameters reinforce the same conclusion. The “no fraud” cluster is tiny (Pi = 0.077), while the “extreme fraud” cluster is dominant (Pi = 0.674). The mean turnout of the extreme-fraud class is the highest (77.8%), and the mean winner share remains very high (65.5%). The incremental-fraud cluster has lower mean winner share (46.2%) but still markedly elevated turnout. In Mebane’s framework, this is exactly how one would read the two suspicious classes: incremental fraud corresponds to more moderate forms of ballot addition or structural advantage, whereas extreme fraud corresponds to more concentrated and aggressive inflation of the winner’s outcome, typically associated with very high turnout and very strong winner performance. The class structure in Bajina Bašta therefore points to a highly asymmetric electoral field in the model’s own terms.
That said, the same caution as before applies. Finite-mixture models are sensitive to sample size and specification. One should not read the 97.05% fraud share as a literal legal measure of fraudulent ballots. It is a model-based indicator of how much of the winner’s vote is associated with suspicious latent classes under the assumptions of the method. Even so, the result is far too large to be brushed aside. If taken seriously as forensic evidence, it places Bajina Bašta among the most suspicious local cases in the current set.
12. Executive Summary
Data and preparation
This report analyzes polling-station-level data for the 2026 local election in Bajina Bašta using a multi-method election-forensics framework. The analysis combines a correlation matrix, regression models, turnout graphics, Klimek curves, election fingerprints, and a finite-mixture model. With 52 polling stations, the municipality allows somewhat more stable inference than smaller local units, though caution remains necessary for the more complex graphical and mixture-based methods.
Turnout and vote shares
Turnout does not appear to have systematically benefited either the ruling list or the main opposition. The correlation between turnout and %SNS is only 0.02, and the correlation with %Ujedinjeni is −0.03. In this respect, Bajina Bašta looks more normal than Aranđelovac.
Voting outside the polling station and vote shares
This is one of the strongest suspicious channels in the municipality. The correlation between outside voting and the ruling share is 0.63, while the correlation with the main opposition is −0.62. In regression analysis, outside voting becomes strongly positive and highly significant (0.945), substantially improving model fit.
Invalid ballots and vote shares
Invalid ballots are also a strong warning sign. Their number is negatively correlated with %SNS (r = −0.59) and positively correlated with %Ujedinjeni (r = 0.60). In regression analysis, the coefficient on invalid ballots is large and highly significant (−0.946), remaining significant even after outside voting is added (−0.526).
Turnout-based forensic regression in the Russian-school tradition
In the additional check based on the Russian school of election forensics, Bajina Bašta also shows that turnout was more beneficial to the ruling list than to the opposition. The estimated slope coefficient for the ruling list is \(\beta = 0.636\) and is highly statistically significant, meaning that higher turnout was systematically associated with a clear increase in ruling-party support relative to the number of registered voters. The opposition list also had a positive slope, but it was not statistically significant, so the main conclusion of this tool is that turnout in Bajina Bašta operated in a politically asymmetric way, though less extremely than in Aranđelovac. This result therefore adds another layer to the broader forensic picture, even if the strongest warning signs in Bajina Bašta still come from invalid ballots, voting outside the polling station, and the finite-mixture model.
Graphical analysis by turnout
The turnout graphics do not suggest that higher turnout systematically favored the ruling side in the 2026 local election. Only the 2017 presidential election shows a statistically significant positive turnout effect for the winner. The local election therefore does not stand out on this particular indicator.
Klimek curves
The Klimek curves are somewhat suggestive, in that the ruling curve continues to rise after 80% turnout while the opposition reaches a plateau. But because the number of high-turnout observations is small, this evidence is too fragile to support strong standalone claims.
Election fingerprints
The fingerprint evidence warrants attention but should be interpreted cautiously. The key concern is the elongated structure toward high winner percentages, especially when compared with earlier election cycles. It is not decisive on its own, but it adds weight to the broader suspicious pattern.
Finite-mixture model
The finite-mixture model is highly alarming. Only 4 polling stations are classified in the no-fraud group, while 35 fall into the extreme-fraud class. The overall model-based fraud-share estimate is about 97.05%, which is extraordinarily high even allowing for methodological caution.
Overall assessment
Taken together, the Bajina Bašta findings provide serious grounds for suspicion that the election result was not generated under fully fair and neutral competitive conditions. Unlike Aranđelovac, the main suspicious channels here are not turnout itself, but the combined structure of outside voting, invalid ballots, and the finite-mixture model. The absence of a turnout anomaly does not neutralize these concerns. On balance, the evidence suggests a local electoral environment that may have been substantially distorted, even if not all forensic indicators point in the same direction.
13. Methodological appendix
This report uses seven complementary election-forensics approaches. Correlation analysis serves as an initial screening device for systematic polling-station-level relationships. Regression analysis tests whether those relationships remain when multiple explanatory variables are considered jointly. Turnout graphics examine whether higher participation disproportionately benefits the ruling side and harms the opposition. Klimek curves assess whether cumulative vote growth resembles a democratic plateau or a more suspicious post-threshold acceleration. Election fingerprints inspect the joint distribution of turnout and winner share, together with the shape of their marginal distributions. Finally, the finite-mixture model classifies polling stations into latent regular and suspicious types and estimates the winner’s vote share associated with each class. None of these methods is conclusive on its own. But together they offer a structured framework for evaluating electoral integrity in a small local setting.